Curated OER
Gold Rush California and its Diverse Population
Young scholars compare contemporary cultural differences with historical differences based on population percentage. For this cross-curriculum Gold Rush/math lesson, students analyze aspects of California's Gold Rush population and...
Education World
The African American Population in US History
How has the African American population changed over the years? Learners use charts, statistical data, and maps to see how populations in African American communities have changed since the 1860s. Activity modifications are included to...
Curated OER
Interest Rates
Use a KWL chart and discussion to explore the concept behind loans with interest based on percentage rates. Learners examine different types of interest, the history of interest loans and calculate the costs of a loan over a ten-year...
CK-12 Foundation
Interpretation of Circle Graphs: Northwest Region Population Pie
Given populations of the five Northwestern states, learners create a circle graph. Using the data and the pie chart, they make comparisons between the populations of the states. Finally, the pupils determine how the chart will change...
Curated OER
6-8 Baseball Fun: Percentages, Decimals, and Fractions
Young scholars practice the concepts behind fractions, decimals, and percents by using sports statistics on baseball cards. In this baseball math instructional activity, students use fractions and estimation to calculate statistics....
Curated OER
Time Management: Piece of Pie
Students examine their own lives and how well they manage their time outside of school. In this this time management instructional activity, students discover the amount of time they spend on other activities, and create a pie chart with...
Curated OER
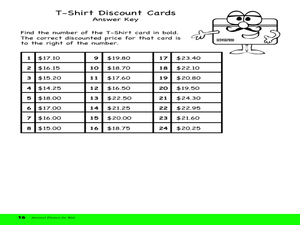
Circle Graphs and Percents
For this circle graph and percentages worksheet, students fill in a chart, write percentages, calculate discounts, and more. Students complete 4 sets of problems.
Curated OER
Making the Connections
Use a Horton Chart to identify relationships between numbers and make equivalent fractions and decimals. Scholars change a fraction to find the greatest common factor, find percents, and make equivalent decimals.
National Security Agency
Partying with Proportions and Percents
Examine ratios and proportions in several real-world scenarios. Children will calculate unit rates, work with proportions and percentages as they plan a party, purchase produce, and take a tally. This lesson plan recommends five...
Curated OER
Junk Food Math
Students use Skittles candies as they explore estimation and percentages. In this math lesson plan, students sort, count, and chart Skittles candies to learn about estimation and study percentages.
Curated OER
Government Goods and Services
Fifth graders investigate the connection between taxes and government services. In this economics lesson, 5th graders discuss the process and benefits of paying sales and income taxes. Using calculators, students compute the...
Curated OER
Did Voters Turn Out -- or Are They Turned Off?
What was the voter turnout at your last state election? Examine voter turnout statistics from the most recent election to learn which ten states have the best turnout record. This lesson offers election data, handouts, and worksheets.
EngageNY
Changing Scales
Pupils determine scale factors from one figure to another and the scale factor in the reverse direction. Scholars compute the percent changes between three figures.
Curated OER
Skittle Around with Fraction and Percentages
Fifth graders investigate the interchangeable relationship betweeen fractions and percents. They discuss the concepts using teacher provided questions. Then sutdents work in cooperative groups to maximize scaffolding.
S2tem Centers SC
Investigating Chance Processes of Probability
How likely is it that the school cafeteria will serve chicken tomorrow? Discover the concept of probability with the roll of the dice. Pupils evaluate the liklihood of several statments about everyday life. Then, a mathematical...
Curated OER
Ratio Basketball
Learners, in teams of four, practice shooting free throws while mentally converting the ratio of shots made to those thrown into a percent. They chart and record the ratio, decimal and actual percentage earned after each round.
Curated OER
Charts and Graphs
Fifth graders interpret data into graphs and percentages. In this organizing data lesson, 5th graders discuss bar, circle and line graphs. Students complete bar graph and apply probability using the results.
Curated OER
Wise Shoppers
Students complete several activities to learn about currency and the functions of money. For this money functions lesson, students complete activities to learn what are the functions of money. Students calculate item prices with...
Curated OER
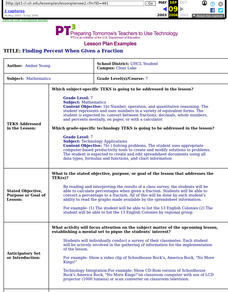
Finding Percent When Given A Fraction
Seventh graders calculate percentages when given a fraction. They convert a percentage to a fraction. All of this be done by each student's ability to read the graphs made available by the spreadsheet information.
Curated OER
If .... Then Probably
Students are introduced to the concepts of probability and chance. Using data given to them, they organize and create a chart to display the information. Using this chart, they calculate the percentage of chance and probability and...
Curated OER
Percents
Students explore the concept of percents. In this percents lesson, students discuss the prefix cent and words that contain that prefix. Students make bead necklaces and determine the percentages of certain beads in relation to the necklace.
Curated OER
Tracking Your Favorite Web Sites
Ninth graders track the hit count on their favorite web sites. In this Algebra I lesson, 9th graders record the number of hits on their favorite web site for twenty days. Students explore the data to determine if the relation...
Curated OER
Paws in Jobland: Lesson Plan 35 - Catch of the Day
Young scholars study information for fish farm workers given in the form of a chart, in order to practice interpreting data while learning about the career of a fisherman. In this data interpretation lesson, students read the chart to...
Curated OER
Mathematics In You
Students construct ratios using the hand as data. They use examples of cortical and trabecular bone found in the long bones to measure circumference, diameter, length, and weight of long bones. They perform computations using growth...
