West Virginia Department of Education
Intelligence of Authentic Character - News Coverage and John Brown's Raid
The resource, a standalone, shows how news coverage of John Brown's Raid began when the event happened and how that reporting shaped perception in West Virginia history. The resource includes interesting anticipatory discussion...
College Board
Civic Knowledge and Action in AP U.S. Government and Politics
Vote, it's your civic duty! The high school lesson focuses on voter turnout and civic participation with a series of activities. Young scholars analyze data to discover voter turnout trends, complete worksheets, and participate in group...
Curated OER
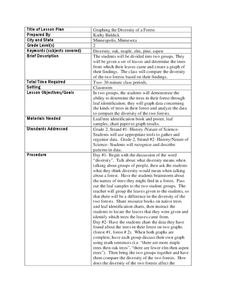
Graphing the Diversity of a Forest
Second graders work in groups to identify what types of trees create which types of leaves In this plant life lesson plan, 2nd graders analyze a set of leaves and identify the tree it came from while graphing the data in a science...
Curated OER
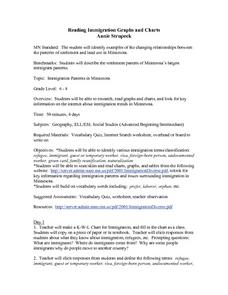
Reading Immigration Graphs and Charts
Students examine the settlement patterns and land use in Minnesota. In groups, they practice reading immigration graphs and charts and discuss why immigrants settled where they did. They are also introduced to new vocabulary related to...
Curated OER
Using Charts and Graphs to Study East Asia's Modern Economy
Students examine East Asia's modern economy. In groups, classmates use the internet to compare the resources, products, and economy of specified countries. After collecting the data, pupils create charts, tables and graphs. They...
Curated OER
Maps and Modes, Finding a Mean Home on the Range
Fifth graders investigate data from maps to solve problems. In this data lesson, 5th graders study maps and collect data from each map. Students present their data in a variety of ways and calculate the mode, mean, median, and range.
Curated OER
Canadian Social Trends
Students use surveys to explore how to design graphs, tables, and diagrams. They discuss articles which can stimulate ideas for research topics, or surveys of their own.
Columbus City Schools
What is Up Th-air? — Atmosphere
Air, air, everywhere, but what's in it, and what makes Earth's air so unique and special? Journey through the layers above us to uncover our atmosphere's composition and how it works to make life possible below. Pupils conduct research...
Curated OER
Patterns In Hexagon Tables
Sixth graders construct a rule about the number of sides found in a pattern of hexagons. In this mathematical problem solving activity, 6th graders observe different hexagon patterns and create a rule about the relationship between the...
Curated OER
Bias in Statistics
Students work to develop surveys and collect data. They display the data using circle graphs, histograms, box and whisker plots, and scatter plots. Students use multimedia tools to develop a visual presentation to display their data.
Curated OER
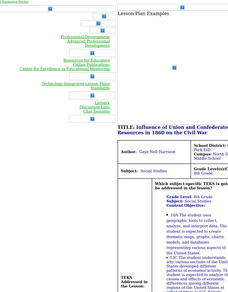
Influence of Union and Confederate Resources in 1860 on the Civil War
Eighth graders compare/contrast population, railroad mileage, manufacturing plants, and industrial workers between the Union and Confederate States in 1860; students analyze effects of the resources of the Union and Confederate Forces on...
Curated OER
A Creative Presentation
Bring writing to life with this lesson in which elementary and middle schoolers create a display of the imagery they identify in a series of Gary Paulsen books. They read the suggested materials, identify imagery and descriptive...
Code.org
Making Data Visualizations
Relax ... now visualize the data. Introduce pupils to creating charts from a single data set. Using chart tools included in spreadsheet programs class members create data visualizations that display data. The activity encourages...
Missouri Department of Elementary
The Successful Student: Picturing the Successful Student
Class groups brainstorm the characteristics that make up a successful student before taking part in a whole class discussion. Assigned group roles promote member participation.
Center for Learning in Action
Density
Explore the concept of density within states of matter—gases, liquids, and solids—through a group experiment in which young scientists test objects' texture, color, weight, size, and ability to sink or float.
Curated OER
Biomimicry, Nature: Architecture of the Future
Students explore the relationship between nature and architecture. In this cross curriculum history, culture, and architecture lesson, students observe and discuss structures visible in nature. Students view websites in which Native...
Curated OER
Trends in Precipitation
Eighth graders study about precipitation and graph the information. They look for patterns in a scatter graph and make inferences based on what they see. They need to see a relationship between location and the amount of precipitation.
Curated OER
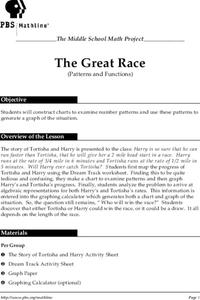
The Great Race
Students are presented with a story about two individuals running a race in which one is given a head start. Students must map the progress of the runners, create a chart examining patterns and graph the progress. In the end, students...
Curated OER
Weather Watchers
Second graders discuss what weather is and list words that can be used to describe weather. In this science lesson, 2nd graders develop symbols for each type of weather and record the weather for two weeks at the same time and the same...
Curated OER
The Great Pollinators
Young scholars discover the reproductive parts of a plant. In this biology lesson, students identify and categorize several different plants they dissect in class. Young scholars record their information using a data chart.
Curated OER
EXCEL It!
Students surf the Web gathering information about graphs. The data collected is incorporated into an Excel spreadsheet and graphs of varying nature generated to further enhance student understanding.
Bowland
Fashionista
So trendy! Show your class how to identify trends in sales patterns using mathematics. Scholars use a software simulation to collect data on age groups, price, and sales at a fashion store. This data allows individuals to determine the...
Curated OER
Student Costs Graph
Students calculate the mileage, gasoline costs, and travel time and costs for a vacation. They conduct a virtual field trip, and create a comparison graph of costs using Microsoft Excel software.
Curated OER
Count on Me
Fourth graders use inductive reasoning to find algebraic patterns in geometric figures. They use technology (i.e., calculators, computers) and manipulatives to discover number patterns involving geometric concepts. They solve concrete...


