EngageNY
Analyzing a Graph
Collaborative groups utilize their knowledge of parent functions and transformations to determine the equations associated with graphs. The graph is then related to the scenario it represents.
EngageNY
Graphing Quadratic Equations from the Vertex Form
Graphing doesn't need to be tedious! When pupils understand key features and transformations, graphing becomes efficient. This lesson plan connects transformations to the vertex form of a quadratic equation.
Curated OER
Regents High School Exam: Living Environment 2008
Tne New York Regents High School Examinations are comprehensive and include various styles of questions, includingmultiple choice and the analysis of graphs. This particular version, the 2008 Living Environment exam surveys a variety of...
Curated OER
Transformation of Graphs
In this college level Pre-calculus worksheet, students examine families of functions and describe how graphs of the transformation can be obtained from the parent graph. The four page worksheet contains seventy-two problems. Answers...
Shodor Education Foundation
Multi-Function Data Flyer
Explore different types of functions using an interactive lesson. Learners enter functions and view the accompanying graphs. They can choose to show key features or adjust the scale of the graph.
Balanced Assessment
Writing and Sketching Resource
Picture this—the class creates pictures using functions. Here, learners build functions to model specific graphic criteria. They use their knowledge of parent functions and transformations to create the perfect function.
Concord Consortium
Intersections I
One, two, or zero solutions—quadratic systems have a variety of solution possibilities. Using the parent function and the standard form of the function, learners describe the values of a, b, and c that produce each solution type. They...
Curated OER
Tim and Pat at the Store: Bar Graphs
Do you like candy? Tim and Pat go to the candy store every day after school. Can you use the chart to determine how much money they spend each day? Does one spend more than the other?
EngageNY
Transforming Rational Functions
Move all rational functions—well, maybe. Learners investigate the graphs of the reciprocals of power functions to determine a pattern between the graph and the power. Pupils graph rational functions where transformations are clearly...
Curated OER
Matrix Analysis of Networks
Explore the connection between a finite graph, a directed graph, and a matrix. Graph lines and identify the relationship of matrices in real-world scenarios. Then use this information to work with a partner to plan and design a town...
Curated OER
Sand Babies
An engaging lesson plan which has elementary learners measure weight to the nearest pound and construct and interpret a bar graph! They measure length using non-standard units and determine area using square tiles. Pupils round their...
Curated OER
Beginning Graphs in MS Excel
Learners practice creating graphs in Microsoft Excel. In this technology instructional activity, students conduct a random survey and collect data. Learners use the Microsoft Excel program to create a bar graph of the data.
School Sparks
Christmas Worksheets for Santa's Little Helpers
Just because children aren't in the classroom over winter break, doesn't mean that learning has to stop. Intended as a resource for parents, this eBook provides Christmas-themed worksheets and activities that engage children in...
Mathematics Vision Project
Module 7: Modeling with Functions
The sky's the limit of what you create when combining functions! The module begins with a review of transformations of parent functions and then moves to combining different function types using addition, subtraction, and multiplication....
EngageNY
Transformations of the Quadratic Parent Function
Efficiently graph a quadratic function using transformations! Pupils graph quadratic equations by completing the square to determine the transformations. They locate the vertex and determine more points from a stretch or shrink and...
EngageNY
Translating Graphs of Functions
If you know one, you know them all! Parent functions all handle translations the same. This lesson examines the quadratic, absolute value, and square root functions. Pupils discover the similarities in the behavior of the graphs when...
EngageNY
Graphing Cubic, Square Root, and Cube Root Functions
Is there a relationship between powers and roots? Here is a lesson that asks individuals to examine the graphical relationship. Pupils create a table of values and then graph a square root and quadratic equation. They repeat the process...
Curated OER
Graphing Memories
Mem Fox’s Wilfrid Gordon McDonald Partridge provides the labels for a graphing activity. Class members create an illustration of a memory item brought from home, and place their illustration in the proper column of a graph. When the...
Curated OER
Counting Votes
Here's a great way to combine a good class discussion on nutrition with math. A class discussion on what can be made from vegetables is held, then learners all vote for their favorite vegetable. A graph is produced that shows the...
Concord Consortium
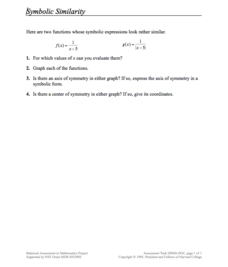
Symbolic Similarity
How many things does one transformation tell you? Learners compare and contrast the graphs of different parent functions with the same transformation. Using a rational and absolute value function, pupils identify key features of their...
Concord Consortium
Functions by the Slice
Piece by piece ... dismantling a function can highlight interesting patterns. The task asks learners to slice functions in sections with the same vertical change. They then recreate the graph with these slices positioned horizontally....
Curated OER
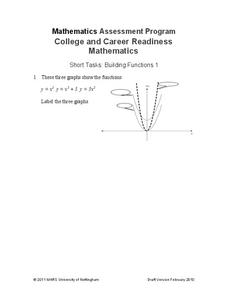
Building Functions
Pupils determine equations that match the graphs of transformations and the parent quadratic function. The resource requires class members to attend to precision and think abstractly.
Concord Consortium
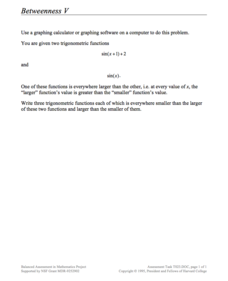
Betweenness V
Take a unique approach to study the graphing of trigonometric functions. Young scholars consider two sine functions and write three functions that will lie between the two given. They use a graphing utility to assist in their explorations.
Fall River Schools
Parabolas Are All Around Us
Moving parabolas off of graph paper and into the real world is the task at hand in this detailed poster project. First, learners perform a cumulative activity identifying many characteristics of an assigned quadratic equation. Next, they...


