Curated OER
Solving Two-Step Inequalities
In this inequalities learning exercise, students use two steps to solve 16 inequality problems. A line graph is provided to graph the answers, and an answer key is provided.
Curated OER
Use a Graph
Information is often presented in graph form. Can your youngsters read a basic bar or picture graph? Six word problems accompany three graphs. One graph is a bar graph and the other two are pictographs.
Curated OER
Number Sense and Operations
In this number sense and operations worksheet, students solve 15 different problems that include number lines and identifying various types of numbers. First, they solve a given equation and then check their work. Then, students find the...
Virginia Department of Education
Solving and Graphing Inequalities
You can't go wrong with a lesson that involves candy! Learners solve and graph one-variable inequalities and use candy to graph the solution. Individuals associate open circle graphs with life savers and closed circle graphs with round...
Curated OER
Read My Bar Graph!
Elementary schoolers make and use bar graphs to picture information. They learn how choosing the right scale for a bar graph can help make a persuasive argument. This is a terrific lesson on graphing which should excite your kids. There...
Curated OER
Integers and the Number Line
In this integers and number line activity, students complete 10 problems by naming the set graphed. Students graph 6 number sets. Then students answer 6 sum problems.
Curated OER
Integers and the Number Line
In this integer and number line worksheet, students in 6 problems name the graphed set of numbers. Students then graph 8 number sets.
Curated OER
Interpreting Data and Statistics using Graphs
Seventh graders interpret data. In this lesson on types of graphs, 7th graders construct, interpret, and analyze different graphs. This lesson includes worksheets and resources.
Curated OER
Usage and Interpretation of Graphs
Students explore graphing. In this graphing instructional activity, students predict how many shoe eyelets are present in the classroom. Students count eyelets and work in groups to organize and chart the data collected. Students put all...
Curated OER
Graphing
In this graphing worksheet, 5th graders identify and graph 20 different problems on the 3 different graphs shown on the sheet. First, they use the tally of callers organized by the school to complete the three different types of graphs....
Curated OER
Graphing Inequalities
In this graphing inequalities worksheet, students solve and graph 10 different problems that include various inequalities. First, they study each of the examples given. Then, students graph the remaining equalities and inequalities as...
Curated OER
Solving Inequalities and Graphing on a Number Line
Students review solving equations. They solve an inequality and discuss how to graph it. Students work together on one inequality and then graph two on their own. This lesson contains links to a PowerPoint and a worksheet.
Illustrative Mathematics
The Intersection of Two Lines
Here is an introduction to solving simultaneous linear equations. Start by drawing a line through two points. Create a second line which goes through the intersecting point. Background knowledge of how to find the equation of a line and...
Utah Education Network (UEN)
The Human Line Plot
Learners collect data and use charts and line plots to graph the data. Some excellent worksheets and activities are embedded in this fine lesson on line plots.
Curated OER
Line of Best Fit
In this line of best fit worksheet, students solve and complete 8 different problems that include plotting and creating their own lines of best fit on a graph. First, they study the samples at the top and plot the ordered pairs given on...
Curated OER
Worksheet 2: Graphs, Functions and Derivatives
In this math worksheet, students answer 7 questions having to do with graphing derivatives of functions, rectilinear motion, speed and distance.
Curated OER
Graphing Systems of Inequalities
Solve equations and graph systems of inequalities. Designed as a lesson to reinforce these concepts, learners revisit shading and boundaries along with solving linear inequalities.
Curated OER
Bar Graphs
Introduce scholars to bar graphs and data analysis through analyzing these visual examples. First, they look at a pictograph of fruit types and answer five observation questions. There is one done for them as an example. Learners do the...
EngageNY
Comparing Integers and Other Rational Numbers
The ninth installment of a 21-part module has pupils compare integers and rational numbers in decimal and fraction form. They match stories to number lines and compare values in the stories.
Curated OER
Easter Graphing Fun
Graphing can be festive! This Easter worksheet has scholars using coordinates to record the location of ten holiday images. The first is done for them, and the grid is large and appealing to younger learners. Consider visualizing this...
Royal Baloo
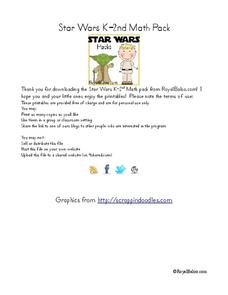
Star Wars K-2nd Math Pack
Included in a Star Wars themed packet, young padawans enhance mathematical skills such as graphing, computing using basic operations, counting numbers and money, telling time, and measuring. Scholars play a game of sudoku, read number...
Curated OER
Introduction to Graphs: Bar Graphs, Line Graphs, Circle Graphs
For this graphing data worksheet, middle schoolers answer 5 short answer questions about graphs. Students determine which type of graph best represents various data sets.
Curated OER
Creating Line Graphs
Students relate data to coordinate graphs and plot points on this graph. They use minimum wage data to construct the graph. Students decide appropriate time intervals for the graphs. They share graphs with their classmates.
Curated OER
Functions and Graphing
Graphing functions in a real world application makes math come to life. Learners graph points on a coordinate plane and identify various points on a graph by working through a set of real world problems. This is a perfect review exercise.


