Howard Hughes Medical Institute
Sampling and Normal Distribution
Young scientists learn about sampling and normal distributions through data analysis. A worksheet guides them to better understanding and synthesis of knowledge.
Shodor Education Foundation
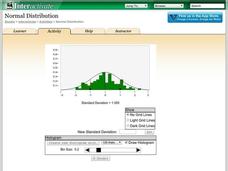
Normal Distribution
Does the size of the bin matter? The resource allows pupils to explore the relationship between the normal curve and histograms. Learners view histograms compared to a normal curve with a set standard deviation. Using the interactive,...
CK-12 Foundation
Properties of a Normal Distribution: Uniform Distributions
There's nothing normal about an extraordinary resource. Scholars change the dimensions of a normal distribution using a slider interactive. Determining the area under the graph gives probabilities for different situations.
Shodor Education Foundation
Skew Distribution
Slide the class into a skewed view. Learners alter the location of the median relative to the mean of a normal curve to create a skew distribution. They compare the curve to a histogram distribution with the same skewness.
CK-12 Foundation
Normal Approximation of the Binomials Distribution: When to Approximate
Normalizing a binomial distribution — determine when it is all right. Given the rule of thumb of when it is appropriate to use the normal distribution to approximate a binomial distribution, pupils look at different scenarios....
CK-12 Foundation
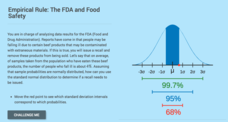
Computing Probabilities for the Standard Normal Distribution: The FDA and Food Safety
To recall or not to recall, that is the question. Using provided data, pupils calculate the percent of people that may fall ill on average. The scholars determine the standard deviation based upon the mean and the empirical rule,...
Curated OER
Determine the 90% Values Given the 50% Values
In this normal distribution learning exercise, students determine the values for the middle 90% given the middle 50% values. Means and standard deviations are provided.
Shodor Education Foundation
Overlapping Gaussians
Adjust the overlap to compare probabilities. Using sliders, learners adjust the shape of two Gaussian curves. The interactive calculates the area of the left tail for one curve and the right tail for the other. Pupils set the interactive...
Curated OER
Breaking News English: One Hundred Dollar Laptop Computer
In this one hundred dollar laptop computer worksheet, learners read the article, answer true and false questions, complete synonym matching, complete phrase matching, complete a gap fill, answer short answer questions, answer discussion...
Curated OER
My Test Book: Division
In this math skills worksheet, students solve 10 multiple choice math problems that regarding division of 2,3, and 4-digit numbers. Students may view the correct answers.
Curated OER
Breeds of Horses
In this online quiz worksheet, students answer a set of trivia questions about horse breeds. Page has a link to submit answers for review.
Shodor Education Foundation
Shodor Interactivate: Normal Distribution
Change the standard deviation of an automatically generated normal distribution to create a new histogram. Observe how well the histogram fits the curve, and how areas under the curve correspond to the number of trials.
Shodor Education Foundation
Shodor Interactivate: Skew Distribution
Change the median and standard deviation of an automatically generated normal distribution to create a skewed distribution, allowing you to observe properties like what it means for the mean, median, and mode to be different.
California State University
Cal State San Bernardino: Bivariate Distribution Applet
The applet is a target at which green darts are shot either with a strict correlation to each other or without -- the user defines this. A good example of how bivariate data is truly influenced by two variables, possibly dependent upon...
Shodor Education Foundation
Shodor Interactivate: Overlapping Gaussians
In this applet you can adjust the parameters on two Gaussian curves to determine if there is a possibility of a difference between the two means.


