Curated OER
Between The Extremes
Students analyze graphs for specific properties. In this algebra lesson plan, students solve equations and graph using the TI calculator. They find the different changes that occur in each graph,including maximum and minimum.
Curated OER
Introduction to Arithmetic and Geometric Sequences
Students examine the concept of sequences. Students create a sequence using varied starting numbers, multipliers, and add on values. Students practice determining the starting values to use in order to produce a desired sequence.
Curated OER
Conic Sections
Students, while using a graphing calculator, graph systems of conic sections as well as identify their solutions. They complete various word problems dealing with conic sections with their calculators. In addition, students sketch graphs...
Curated OER
Investing
Students collect data on investments and draw conclusions. In this algebra lesson, students analyze exponential graphs as they relate to money. They discuss the cause of an account balance being high or low.
Curated OER
My Peanut Butter is Better Than Yours!
Students explore the concept of statistical data. For this statistical data lesson, students read an article about the dangers of peanut butter to those who are allergic. Students perform a taste test of two different brands of peanut...
Alabama Learning Exchange
The State Capital of Stem and Leaf
Students explore the concept of stem and leaf plots. In this stem and leaf plots lesson, students plot the 50 US states' capitals on a stem and leaf plot according to the first letter of each state. Students compare their stem and leaf...
Curated OER
Normal Probability Plot
Students analyze the graph of a distribution. In this statistics lesson, students define skewed or mound shape distribution as they investigate the data behind the graph. They define and plot outlier as well as normal probability.
Curated OER
Leaf Patterns
First graders explore the existence of patterns in everyday items. In this science and math integrated lesson, 1st graders match leaves with a name word card and organize them into four patterns. This lesson includes a reading of And the...
Curated OER
WINDMILL POWER
Young scholars study operations with real numbers using mental computation or paper-and-pencil calculations. They judge the reasonableness of numerical computations and their results. They set up and solve proportions for direct and...
Kenan Fellows
Math Made Simple as 1-2-3: Simplified Educational Approach to Algebra
Writing an equation of a line is as easy as m and b. A lesson presentation gives individuals different strategies for writing equations of lines. Some items provide a slope and a point while others provide two points. Whatever the given,...
Achieve
Stairway
It's the stairway to learning! Scholars research all aspects of building a staircase. Using information from building codes, they write and graph a system of inequalities to analyze the constraints. The completed project is a scale model...
Illustrative Mathematics
Lake Algae
Introduce learners to exponential growth with this real-world problem about algae that is rapidly spreading across a lake in a city park. The task presents the rate of growth and an end value and asks learners to determine what happened...
Curated OER
Viewing Tubes
Learners complete a lab in order to discover if the length of a viewing tube, its diameter, or the distance from an object affect the type of data collected and the resulting graph.
Curated OER
View Tubes
Eighth graders decide if the length of a viewing tube, its diameter, or the distance from an object affects the type of data collected and the resulting graph through a series of experiments.
Curated OER
Bubble Gum Chemistry
Students explore the concept of graphing data. In this graphing data lesson, students determine the percentage of sugar in bubble gum. Students graph type of gum vs. sugar percentage. Students create a table of their data.
Curated OER
What Are The Chances
Pupils calculate the probability of an event occurring. In this probability lesson, students differentiate between independent, dependent or compound events. They find the range of the data.
Curated OER
Maximizing Your Efforts
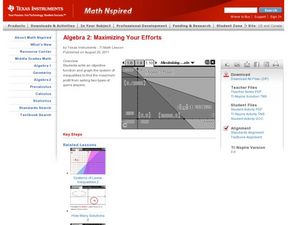
Students graph systems of equation. In this algebra lesson, students find where the lines cross and identify the type of solution. They analyze a graph and write the equation of the line.
Pennsylvania Department of Education
Alike and Different
Students compare and contrast objects and are introduced to a Venn Diagram. In this alike and different instructional activity, students make observations regarding properties of objects. Students classify object and build ideas about...
Curated OER
Numerical Analysis: Polynomial Interpolation
For this polynomial worksheet, students identify the interpolated and extrapolated value of given equations. This four-page worksheet contains approximately ten problems. Explanations and examples are provided.
Curated OER
Topic 6: Evaluating and Presenting Results
Students construct spreadsheets from raw data. For this spreadsheet construction lesson, students compile data into Microsoft Excel. Students familiarize themselves with entering and presenting data in a spreadsheet.
Curated OER
Confusing Colors!
Fourth graders collect data, graph their data, and then make predictions based upon their findings. They's interest is maintained by the interesting way the data is collected. The data collection experiment is from the psychology work of...


