Curated OER
Find Minimum and Maximum
Learners engage in a lesson about finding the values of different graphs written in the vertex form. They rewrite each quadratic equation in vertex form while graphing the equation with the visual display of a parabola that matches the...
Curated OER
Make a Pass at Me
Learners identify different types of functions and units of measurements. In this statistics lesson plan, students will collect data, graph their data and make predictions about their data. They plot a linear regression graph.
Curated OER
Exploring Function Graphs
Tenth graders investigate three different sets of data that relate temperature to another variable in the physical world. These illustrate linear, inverse and exponential relationships.
Curriculum Corner
8th Grade Math Common Core Checklist
Ensure your eighth graders get the most out of their math education with this series of Common Core checklists. Rewriting each standard as an "I can" statement, this resource helps teachers keep a record of when each standard was taught,...
Curriculum Corner
8th Grade Math "I Can" Statement Posters
Clarify the Common Core standards for your eighth grade mathematicians with this series of classroom displays. By rewriting each standard as an achievable "I can" statement, these posters give students clear goals to work toward...
Mathalicious
The Fall of Javert
Falling off a bridge might not sound like your idea of a good math problem, but incorporating the final scene of Les Misérables is sure to spark interest. The goal is to use the time Javert fell off the bridge to determine how high he...
Curated OER
Patterns and Functions
Students investigate properties of perimeter and area. In this middle school mathematics activity, students explore patterns in a problem solving context. Students model and solve problems using various representations for the data as...
Curated OER
Comparing Investments
Money, money, money. A complete lesson that makes use of different representations of simple and compound interest, including written scenarios, tables, graphs, and equations to highlight similarities and differences between linear and...
Curated OER
Logarithmic Transformations of Data
Students investigate and study logarithmic equations. In this precalculus lesson, students analyze the data behind the function. They define each graph as positive, negative or no correlation. They find the line of best fit.
Curated OER
Quadratics: Polynomial Form
Students determine how to use the polynomial form of a quadratic equation to find the location of the vertex on a graph. They determine how changes in the coefficients in a quadratic function affect its vertex on a graph. Students find...
Curated OER
Quadratics: Polynomial Form
Students determine how changes in the coefficients in a quadratic function affect its graph. They Solve a quadratic equations. Students Determine how to use the equation to determine the intercepts of a quadratic function. They...
Curated OER
Guess My Rule - Linear
Students examine the relationship between two equations. In this algebra activity, students investigate linear and non-linear relationships between two equations. They discuss functions of graphs, tables and equations.
Inside Mathematics
Squares and Circles
It's all about lines when going around. Pupils graph the relationship between the length of a side of a square and its perimeter. Class members explain the origin in context of the side length and perimeter. They compare the graph to the...
Kenan Fellows
Math Made Simple as 1-2-3: Simplified Educational Approach to Algebra
Writing an equation of a line is as easy as m and b. A lesson presentation gives individuals different strategies for writing equations of lines. Some items provide a slope and a point while others provide two points. Whatever the given,...
Curated OER
Show Me the Money
Pupils investigate financial applications of mathematics in this mathematics instructional activity. They will investigate equations that represent a company’s income, expense, and profit functions and use those equations to identify...
Curated OER
TI-Nspire Activity: What Does Your Representation Tell You?
By learning to select the best representation for three meal plans, students compare three meal plans to determine the best choice. Data for the meal plans is sorted on a table, as an algebraic equation, and graphed on a coordinate grid....
Illustrative Mathematics
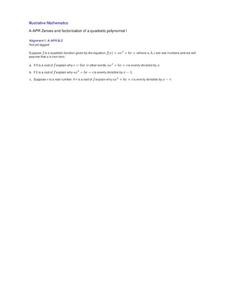
Zeroes and factorization of a quadratic polynomial I
This activity uses the division algorithm and the definition of a zero/root of a function to guide your class to see the relationship between zeros and factors of a general quadratic, which can later be generalized to the Remainder...
Pennsylvania Department of Education
Alike and Different
Students compare and contrast objects and are introduced to a Venn Diagram. In this alike and different lesson, students make observations regarding properties of objects. Students classify object and build ideas about variables....
Curated OER
Maximizing Your Efforts
Young scholars graph systems of equation. In this algebra lesson, students find where the lines cross and identify the type of solution. They analyze a graph and write the equation of the line.
Curated OER
Reading Graphs
Students practice plotting functions on the Cartesian coordinate plane, see several categories of functions, including lines and parabolas, and read a graph, answering questions about the situation described by the graph
Curated OER
Reading Graphs
Students plot functions on the Cartesian coordinate plane. They explore lines and parabolas. Students analyze graphs and answer questions about the information presented on the graph using an online program.
Curated OER
Between The Extremes
Students analyze graphs for specific properties. In this algebra lesson, students solve equations and graph using the TI calculator. They find the different changes that occur in each graph,including maximum and minimum.
Curated OER
Quadratics: Polynomial Form
Students determine how changes in the coefficients in a quadratic function affect its graph. They determine how to use the equation to determine the intercepts of a quadratic function. Students identify the location of the intercepts...
Curated OER
Round and Round and Round We Go!
Students investigate motion using a CBL. In this algebra lesson, students collect and graph data on a coordinate plane. They define and identify amplitude and period of conic graphs.


