Curated OER
New York State Testing Program Grade 8 Math Sample Test 2005
In this New York state sample test activity, 8th graders solve thirty-three sample math problems designed to help students prepare for the grade eight math test. Tips for taking the test are provided.
Teach Engineering
Where Are the Plastics Near Me? (Mapping the Data)
The last activity in a nine-part series has teams create a Google Earth map using the data they collected during a field trip. Using the map, groups analyze the results and make adjustments to the map to reflect their analysis. A short...
Curated OER
Map Studies - Estimate And Measure Distance
First graders explore estimating and measuring distances. They analyze and discuss a map of New York State, make estimations, measure distances using yarn, and calculate total distances between cities on the map.
Curated OER
Is the Hudson River Too Salty to Drink?
Students explore reasons for varied salinity in bodies of water. In this geographical inquiry lesson plan, students use a variety of visual and written information including maps, data tables, and graphs, to form a hypothesis as to why...
Curated OER
From Hypothesis to Conclusion...Reading Maps to Understand Proofs
Tenth graders explore the concept of proof. In this proof instructional activity, 10th graders work in groups to collectively write proofs for directions to places on a map. Students give directions to specific places in big cities such...
Curated OER
Westward Expansion
Students locate California and New York on a map and explore available means of travel in the 19th century. Students explore the role of trade in pioneer America and simulate various barter transactions.
Curated OER
Mapping Meteorites
After reading an article, "Cameras Capture a 5-Second Fireball and Its Meteorite's Secrets," space science superstars use the triangulation method to determine the location of a distant object. In-class activities and homework are...
Curated OER
Charles Lindberghs's Flight to Paris
Students practice map skills. In this map skills lesson, students locate the cities of New York and Paris on a map. Students read about the flight made by Charles Lindbergh in May 1927 from New York to Paris. Students answer 8 questions...
Federal Reserve Bank
Piggy Bank Primer: 25 Cents Worth of History
It's all about money. Here's a resource that introduces kids to the Federal Reserve System, different coins produced by the mints, and fun facts about state coins.
Curated OER
On the Trail of the Blue Crab
Third graders read the article "Blue Claw," discuss crab migration, and look at a map of the Hudson River. They complete a worksheet where they must use subtraction to determine the distance migrating crabs travel.Web links, article, and...
Curated OER
Add and Subtract with Hudson River shipping
Rivers aren't just a place for animals to live, they also provide industrial transportation. The class will examine the Hudson River on a map, discuss all the commercial vessels that use the River to transport materials, then complete a...
Curated OER
Investigation - The Local Bagel Shop
Sixth graders investigate unit pricing to find which cup of coffee is a better buy. They use ratio and proportions to solve problems involving a change of scale in drawings, maps, recipes, etc. Students determine the unit cost of items...
Curated OER
Places and Production
Students calculate United States GDP and GDP per capita, use a choropleth map to acquire information, and create choropleth maps of GDP per capita in South America. They identify regions with high and low GDP per capita
Curated OER
Chain Across the Hudson Lesson Plan A - Locating the Chain
Learners read a letter from George Washington requesting them to identify on a map a location that would stop the advance of British warships. They choose a location and justify their choice.
Curated OER
Infrared-Hot
Students describe how the sun heats the Earth, explain the nature of infrared light, explain how thunderstorms are formed and use infrared maps to predict severe weather.
Curated OER
Apple Kinds to Products
Students become familiar with various kinds of apples and the tree they grow on. In this Apple tree instructional activity, students recognize the differences between apples and can identify what happens to apples in different...
Curated OER
Mayor Puts City on Diet to Lose a Million Pounds
Learners read a story called Mayor Puts City on Diet to Lose a Million Pounds and answer vocabulary and comprehension questions about it. In this current event Lose a Million Pounds lesson plan, students respond to literature by...
Curated OER
Estimating Distances
Fifth graders explore the concept of estimating distances between two places on a map. In this estimating distances lesson, 5th graders interpret maps according to measuring distance. Students choose a place on a map and find the...
Curated OER
Places and Production
Students investigate the economy and the market value of goods. In this algebra instructional activity, students differentiate between domestic goods value and international good value. The define and identify the importance of GDP or...
EngageNY
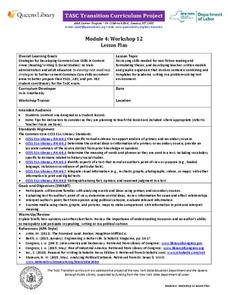
TASC Transition Curriculum: Workshop 12
How can opinions slant facts? Workshop participants learn how to examine primary and secondary sources and identify the author's point of view. They also examine how visual art impacts the meaning and rhetoric of sources. Full of...
EngageNY
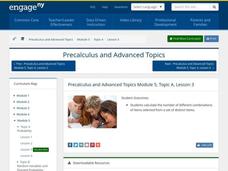
Counting Rules—Combinations
Discover how combinations are different from permutations. In the third installment of a 21-part module, scholars learn how to determine combinations of objects. They learn to distinguish between situations where order is important and...
Curated OER
Analyze This
Students gain practice in the analysis of various types of graphs common in daily life. These examples often use graphic images like charts, graphs, tables, and pictures to supplement learning.
EngageNY
Modeling an Invasive Species Population
Context makes everything better! Groups use real data to create models and make predictions. Classmates compare an exponential model to a linear model, then consider the real-life implications.
Curated OER
Investigation: The Local Bagel Shop
Sixth graders explore economics by solving business math problems. In this ratio and proportion lesson, 6th graders examine different meals to be purchased at a coffee shop and compare which prices make which meals a better purchase....


