Hi, what do you want to do?
Curated OER
Weather for Health
Ninth graders encounter various types of numerical information (represented in multiple ways), much of which is abstract and difficult to comprehend. In this lesson, 9th graders will convert given information into bar graphs. In the...
Curated OER
Weather temperatures
High schoolers investigate the given statistics about temperatures in cities around the nation in order to look for a pattern. They measure the mean, median, and mode for the data set of temperatures.
Curated OER
Statistically Lyrical
Students examine and discuss the writing of ratios as fractions and where they can be found in the real world. They complete worksheets and a questionnaire, and calculate the mean, median, and mode scores for the class.
Curated OER
How Wealthy Are Europeans?
Students investigate measures of central tendency. They examine compiled data and conduct critical analysis. The graph is focusing on the gross domestic product data. The lesson also reviews the concept of putting values in order of...
Curated OER
Words To Numbers
Seventh graders explore the four steps to problem solving. After observing a problem solving chart and discussing each step, 7th graders solve individually assigned word problems. Upon completion, they share their information with the...
Curated OER
How Psychologists Do Research
Students discover how psychologists complete their research on different topics. In groups, they describe the elements of an experiment and the importance of sampling during research. They identify ethical issues in their research and...
Curated OER
How Oceans Affect Climate
Learners draw conclusions about how the ocean affects temperature. In this weather lesson, students use the Internet to gather data to help them come to a conclusion about how the climate in a certain region is directly affected by the...
Curated OER
FLIGHT FAIR
Learners conduct their personal investigations into paper airplane flight. Cooperative teams are formed, with students choosing the paper airplane design that they are most interested in building.
Curated OER
Infusing Equity Gender into the Classroom
Students investigate if gender makes a difference in the classroom. For this statistics lesson, students collect data on whether equity by gender in the classroom makes students more successful.
Curated OER
Drops on a Penny
A helpful worksheet describes an interesting demonstration on the surface tension of water. Learners guess how many drops of water the heads side of a penny will hold. This resource does a great job of describing just how a penny can...
Curated OER
Averages
In this averages worksheet, students complete word problems where they find the average (sometimes called 'mean') of numbers. Students complete 10 multiple choice word problems.
Curated OER
Chips Ahoy A Thousand Chips In Every Bag
Sixth graders determine whether Nabico's claim to sell 1000 chocolate chips in every 1 pound bag of Chips Ahoy! is true.
Curated OER
Our Class Record Book
Second graders, in groups, prepare a list of proposed record ideas for the class book.
Curated OER
Running The Business
In this career instructional activity, students are asked to look at the six stages necessary for the success of running a hypothetical new business.
Mangahigh
Mangahigh: Data: Use the Range and Mode
This site provides students practice with the concept of range and mode. Students can learn about the topic by completing an interactive tutorial. Students can then take a ten question timed test to practice the skill.
Missouri State University
Missouri State U.: Statistics: Measures of Central Tendency and Variability
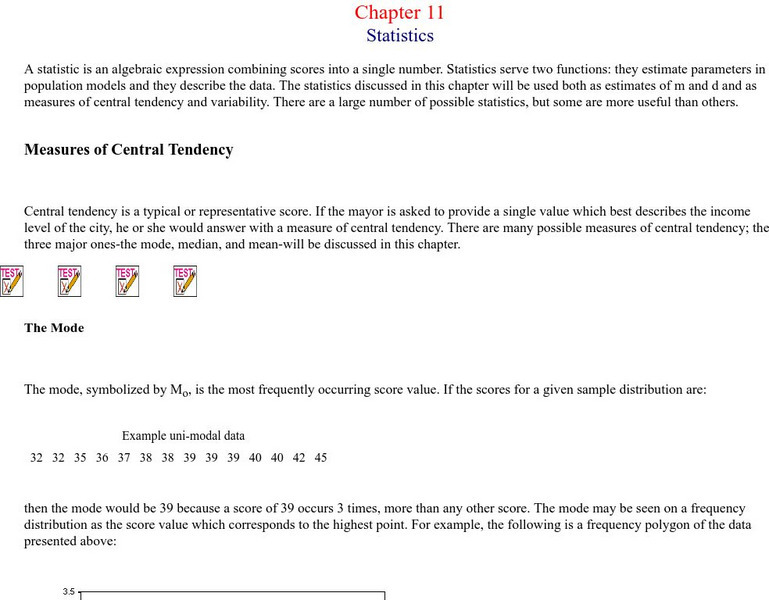
Provides lengthy explanations of the measures of central tendency - mean, mode, and median - and the measures of variability - range, variance, standard deviation. Graphs of interesting examples are presented as well, skewed...
Math Drills
Math Drills: Statistics and Probability Worksheets
Download these free worksheets to sharpen your skills with statistics and probability. Sheets focus on collecting and organizing data, measures of central tendency (mean, median, mode, and range), and probability.
McGraw Hill
Glencoe: Self Check Quizzes 1 Median, Mode and Range
Use Glencoe's randomly generated self-checking quiz to test your knowledge of median, mode and range. Each question has a "Hint" link to help. Choose the correct answer for each problem. At the bottom of the page click the "Check It"...
Education Place
Houghton Mifflin: Eduplace: Extra Practice Quiz Mean, Median, Mode, Range 2
Practice using the graph to answer questions about the mean, median, mode and range. Read the interactive quiz rules and then click on the "Begin" ticket. If you answer incorrectly you get one more chance to try again then you are told...
Education Place
Houghton Mifflin: Eduplace: Extra Practice Quiz Mean, Median, Mode, Range 1
Practice using the graph to answer questions about the mean, median, mode and range. Read the interactive quiz rules and then click on the "Begin" ticket. If you answer incorrectly you get one more chance to try again then you are told...
BBC
Bbc Skillswise: Averages and Range
BBC Skillswise provides multiple factsheets, quizzes, activities, and worksheets on averages and variations.
CK-12 Foundation
Ck 12: Statistics: Stem and Leaf Plots Grade 7
[Free Registration/Login may be required to access all resource tools.] Draw and use stem-and-leaf plots to display and organize data.
Other popular searches
- Mean Median Mode and Range
- Mean, Median, Mode, and Range
- Median Mode and Range
- Mean, Median, Mode and Range
- Mode, Median and Range
- Median, Mode and Range
- Range, Median and Mode
- Mean, Median. Mode, and Range
- Range, Median, and Mode


