Curated OER
Graphs of Quadratic Functions Section 11.6
In this graphing worksheet, students graph quadratic functions. They identify the maximum and minimum value of the function, determine the line of symmetry, and locate the vertex. Coordinate planes are provided for each function. There...
Curated OER
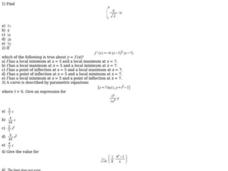
Calc 3 Review Problems - Function
In this integral learning exercise, students evaluate integrals, integrate functions, find directional derivative of a function, identify the maximum and minimum values of a function, and compute Cartesian coordinates. This two-page...
Curated OER
Multivariable Calculus Quiz 7
In this math worksheet, students practice using the concept of multivariable optimization. They find the maximum and minimum values of the surface z.
Curated OER
The Second Derivative Test for Relative Extrema in Three Dimensional Space
In this math worksheet, students seek to find the relative maximum and minimum values of surfaces in three dimensional space for the function.
Curated OER
Discussion Sheet 3
For this math worksheet, students determine the maximum and minimum values for the functions. Then they evaluate the double integrals.
Curated OER
Worksheet 6
In this integral worksheet, students are given 20 short-answer problems regarding integrals, temperature, time, limits, maximum & minimum values.
Curated OER
Froot Loop to the Max - Ordered pairs
In this Froot Loop to the Max worksheet, students complete 21 different sets of ordered pairs. They plot each of the ordered pairs listed on the sheet, connecting them in order from #1 through #21. Then, students determine whether it is...
Curated OER
Graph of a Function
In this graph of a function worksheet, students graph a function and find the value at a given point. They determine the absolute minimum and maximum of an interval. This two-page worksheet contains three problems.
Illustrative Mathematics
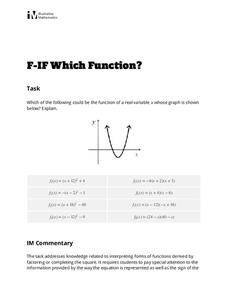
Which Function?
Learners are given a graph of a parabola on a coordinate system, but intercepts and vertex are not labeled. The task is to analyze eight given quadratic functions and determine which ones might possibly be represented by the graph. The...
Flipped Math
Unit 10 Review: Quadratics
Everything one wanted to know about parabolas in one place. Pupils work 27 problems as a review of the unit on quadratics. Problems range from determining key features of the function and using that information to graph the parabola, to...
Curated OER
Representing Data 2: Using Box Plots
What information can be gleaned from a box and whiskers plot? Discuss the five summary values - minimum, maximum, upper and lower quartiles, and median - and what conclusions can be made from these values? Included here is a matching...
CK-12 Foundation
Understand and Create Line Graphs: Line Graphs
Explore line graphs and their characteristics through an interactive lesson. Scholars follow a set of directions to plot data on a line graph. They then answer questions about the type of variables, minimum and maximum values, and...
Illustrative Mathematics
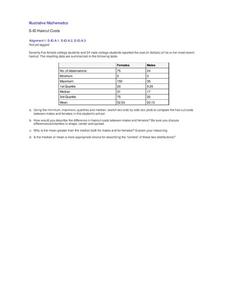
Haircut Costs
Who pays more for haircuts, men or women? Given quartile values, learners construct box and whiskers plots and interpret the results. They compare the mean and median, and discuss which is more appropriate under particular conditions....
Curated OER
Graphing Quadratic Equations with a Coefficient of One
This is a teacher page for a lesson and does not include any materials to support the lesson. Students graph quadratic equations with a coefficient of one and create a table of values to graph a quadratic equation. They plot the values...
Curated OER
It's All In How You Look At It
Students work collaboratively to create artistic renderings of digital photographs using a color value scale and grid techniques in this late-elementary school lesson based upon Ted Rose's book Discovering Drawing. The lesson includes a...
Curated OER
One Dollar Around the World
Twelfth graders collaborate via ePals with another student from another country. They compare the value of a dollar with its power of acquisition in other countries. They list one dollar items and find the corresponding price in other...
Curated OER
Inflation and Unemployment
Twelfth graders are introduced to the relationship between inflation and unemployment. They define the employment and unemployment rate and practice calculating the figures. Analyzing minimum wage laws, they model a process for...
Curated OER
Finding Roots and Newton's Method
In this roots worksheet, students identify the local maxima and minima for a function. Students find the roots of the function using roots and Newton's Method of approximation. This three-page worksheet contains examples, explanations...
Curated OER
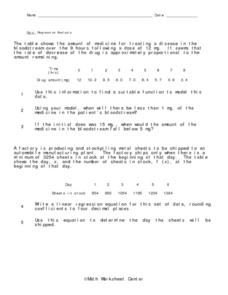
Regression Analysis
In this regression analysis worksheet, 9th graders solve 10 different word problems related to regression analysis. First, they use the information given to find a suitable function to model the data. Then, students use the model to...
Curated OER
Derivatives
In this calculus activity, students solve functions by using the derivatives. The calculate the maximum and minimum of each function presented. There are 28 questions.
Curated OER
Quadratic Functions
In this algebra activity, students graph quadratic functions and identify the vertex, axis of symmetry, maximum and minimum and intercepts. There are 7 questions.
Curated OER
Calculus Worksheet: Graphs of Functions (2)
Students are given a trigonometric function. They find the period of f, the maximum and ninimum values of f(x). Students compute the smallest positive value of x and the smallest positive value of x. They sketch the graph of the function.
Willow Tree
Box-and-Whisker Plots
Whiskers are not just for cats! Pupils create box-and-whisker plots from given data sets. They analyze the data using the graphs as their guide.
EngageNY
Analyzing a Graph
Collaborative groups utilize their knowledge of parent functions and transformations to determine the equations associated with graphs. The graph is then related to the scenario it represents.


