Texas Instruments
Minimums, Maximums and Zeroes
Young mathematicians will identify the minimum, maximum-and zeros of a function in this calculus lesson. They relate the derivative of a function to its zeros and minimum or maximum. They then graph their solutions and explain different...
Curated OER
Maximum/ Minimum Problems
For this optimization worksheet, students solve 20 short answer word problems. Students read, sketch, define variables, write equations, differentiate their equations, and find the maximum or minimum of each word problem.
Curated OER
Minimum, Maximum and Quartiles
For this statistics worksheet, students identify the different parts of a whisker plot. They find the minimum, maximum and the three different quartiles. There are 8 multiple choice questions with an answer key.
Curated OER
Mean, Median, Mode, Minimum, Maximum Posters
Introduce mean, median, and mode and post these bright posters in your classroom. The posters focus on the vocabulary and highlights the answer choice. Each one is colorful, which will engage and attract your learners.
Curated OER
Maximum and Minimum of Functions
In this calculus worksheet, students are given functions and values to derive using the functions. They are asked to find the maximum, minimum and point of inflection. There are 28 questions.
Shodor Education Foundation
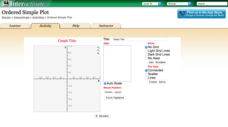
Ordered Simple Plot
Open your imagination to make algebra-inspired creations. An interactive lesson has scholars graph images from a set of parameters. Users can practice minimum values, maximum values, and scale as well as key features.
Curated OER
Derivatives and Maximum or Minimum
In this calculus worksheet, students calculate the maximum, minimum, and determine if the graph is concave up or down. There are 2 questions.
Curated OER
Lesson 2-5: Absolute Value Functions and Graphs
What is absolute value? What is an absolute value function? Emerging mathematicians solve equations containing variables inside an absolute value sign. They graph each function on a coordinate plane and identify the maximum and minimum...
Curated OER
Absolute Maximum and Minimum
Students engage in a lesson that is concerned with the concepts of absolute maximum and minimum while solving for absolute extrema. They solve example problems that are used for direct instruction, guided practice, and independent...
Curated OER
Worksheet 23 - Directional Derivative
In this function worksheet, students compute the directional derivative of a function and identify the xy-coordinates of the maximum and local minimum. This two page worksheet contains six multi-step problems.
Curated OER
Worksheet 12: Relative Maximum and Minimum
In this relative maximum worksheet, students determine the velocity and the relative maximum and minimum of given functions. They identify continuous functions and illustrate their graphs of functions. This three-page worksheet...
Curated OER
Applied Maximum/Minimum Problems
In this maximum and minimum worksheet, students determine the dimensions of given figures inscribed within other figures or within graphs. This one-page worksheet contains seven dimension problems.
Curated OER
Representing Data 2: Using Box Plots
What information can be gleaned from a box and whiskers plot? Discuss the five summary values - minimum, maximum, upper and lower quartiles, and median - and what conclusions can be made from these values? Included here is a matching...
Willow Tree
Line Plots
You can't see patterns in a jumble of numbers ... so organize them! Learners take a set of data and use a line plot to organize the numbers. From the line plot, they find minimum, maximum, mean, and make other conclusions about the data.
Curated OER
Absolute Maximum and Minimum
Students calculate the maximum and minimum of each function. In this algebra lesson, students collect and graph data to analyze it. They differentiate between the absolute max and min and the maxima and minima of each function.
Curated OER
Minimum and Maximum of a Graph
Students find the solutions of polynomials through graphing. In this algebra instructional activity, students identify the maximum and minimum of each polynomial function. They ind the vertex, domain and range of a parabola.
Curated OER
Find Minimum and Maximum
In this number range worksheet, students solve 21 problems in which a series of five numbers is analyzed. Students record the minimum and maximum numbers. There are no examples.
Curated OER
Maximum Volume of a cuboid and open-topped box
In this Algebra II/Pre-Calculus learning exercise, students investigate the maximum volume of a cuboid and the maximum volume of an open-topped box. Additionally, students determine the acceptable size for boxes to meet parcel service...
Curated OER
Curve Sketching Review Worksheet
In this curve sketching instructional activity, students solve 13 short answer and graphing questions. Students find maximums, minimums, critical points, turning points, increasing/decreasing intervals, etc.
Curated OER
Lesson 10-6: Using the Quadratic Formula
In this quadratic formula worksheet, students solve 5 quadratic problems. Students use the quadratic formula to find maximums, minimums, roots, and y-intercepts.
West Contra Costa Unified School District
Using Derivatives to Graph Polynomials
You can learn to graph as well as a calculator using calculus. The lesson introduces using derivatives to find critical points needed to graph polynomials. Pupils learn to find local maximums and minimums and intervals of increase and...
Charleston School District
Contextualizing Function Qualities
Let the graph tell the story! Adding context to graphs allows learners to analyze the key features of the function. They make conclusions about the situation based on the areas the graph is increasing, decreasing, or has a maximum or...
Explore Learning
Quadratics: Polynomial Form
Throught this subscription-based sight, learners explore different aspects of the parabola by changing equations from standard to vertex form. Next, find the general form of the vextex based on the values of a, b, and c, and investigate...
Curated OER
Introduction to Applied Maximum Minimum Problems
Twelfth graders solve problems by finding the maximum and minimum. In this calculus lesson, 12th graders analyze certain animals identifying their maximum and minimum points. They also use bubble as part of their real world application...
Other popular searches
- Maximum Minimum
- Maximum Minimum Parabolas
- Maximum Minimum Mode
- Maximum Minimum Extrema
- Global Maximum or Minimum
- Free Lessons Maximum Minimum
- Maximum Minimum Mode Range
- Maximum Minimum Sets Venn
- Maximum Minimum Graph
- Maximum Minimum Extremism
- Venn Diagram Maximum Minimum
- Maximum Minimum Extremum


