Curated OER
Discovering PI
In this pi worksheet, students identify and complete 4 different problems that include pi and graphing data points. First, they complete the chart at the top by measuring the diameter and circumference of each object. Then, students plot...
Curated OER
Univariate Data Analysis
Students use given data to compare baseball players. They create box and whisker plots to compare the players and determine which they feel is the best player. Students use calculators to make box and whisker plots. They write paragraphs...
Curated OER
Separate Vacations
Young scholars plot the migration paths of birds using latitude and longitude data from a table.
EngageNY
Estimating Probability Distributions Empirically 2
Develop probability distributions from simulations. Young mathematicians use simulations to collect data. They use the data to draw graphs of probability distributions for the random variable in question.
CPO Science
Physics Skill and Practice Worksheets
Stop wasting energy searching for physics resources, this comprehensive collection of worksheets has you covered. Starting with introductions to the scientific method, dimensional analysis, and graphing data, these skills practice...
Curated OER
M&M Science and Math
A series of math and science activities feature M&M's® as manipulatives to help kids work through equations. The resource includes exercises on finding averages, percent of compositions, moles in chemical reactions, genotypes and...
Curated OER
Math Games for Skills and Concepts
A 27-page packet full of math games and activities builds on algebra, measurement, geometry, fractional, and graphing skills. Young mathematicians participate in math games collaboratively, promoting teamwork and skills practice.
Curated OER
Velocity of Traffic on Highway 26
Physics fanatics time five cars as they pass on the highway. They use the times and a 20-yard distance to calculate velocity. They also graph distance vs. time. A page of student pre-lab questions is provided in addition to the activity...
Curated OER
Statistics
In this statistics worksheet, 8th graders solve and complete 10 different problems that include the measures of variation in statistics. First, they determine the range, median, upper and lower quartiles, and interquartile range for each...
Curated OER
The Big Bang-Hubble's Law
For this Hubble's law worksheet, students use data for galaxies which include their distance and speed. Students make a graph to show the distance to each galaxy and the speed of each galaxy. They use their graph to answer 4 questions...
Curated OER
Water on the Moon!
In this moon instructional activity, students read about the data collected from the Deep Impact/EPOXI and Cassini missions to the moon that have detected the presence of hydroxyl molecules under the moon's polar craters. Students solve...
Curated OER
College Costs are on the Rise
High schoolers examine college costs in different states. In this college cost lesson, students create a table and determine the average cost of college for the states listed. They organize the data into measurement categories. High...
Curated OER
Orbital Mechanics
Twelfth graders examine the misconceptions of Newton's laws of motion. In this motion and gravity lesson students interpret data and see the effects of gravity.
Curated OER
Energy Conservation (Middle, Mathematics)
Students take turns reading the electric meter six times a day at regularly scheduled intervals. They figure out the amount of electricity used and then determine the total cost of electricity for the week.
Curated OER
The Appearance of a Graph
Sixth graders understand that the appearance and increment used on the x and y axis in a graph change how it looks. In this graphing activity, 6th graders work in pairs and interpret graphs using different axes. Students collect graphs...
Curated OER
Contour Map
In this contour map worksheet, students create 3 different contour maps by highlighting all the data points with the same value and connecting the dots.
Curated OER
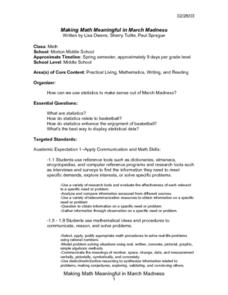
Making Math Meaningful in March Madness
Pupils examine the statistics of March Madness, the college basketball tournament. They watch videotaped basketball games to collect data for further analysis using Word and Excel. They analyze the data in a variety of activities during...
Curated OER
Weather Instrument Data Chart 2
In this science worksheet, high schoolers look for the data that is needed to fill in the graphic organizer. The prefixes are given that are needed to sort the information as it is collected.
Curated OER
My Metric System Smile
In this measurement worksheet, students measure their smile and the smiles of people in their group using centimeters and millimeters. Students combine their data with their classmates' data to analyze and write a brief conclusion.
Curated OER
Class Ketchup
Learners describe statistics by conducting a class cooking activity. In this ketchup lesson, students conduct a class survey based on ketchup consumption habits by learners. Students utilize tomatoes, water and a bottle to create their...
Curated OER
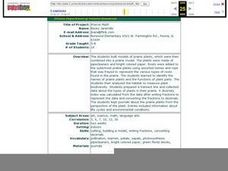
Prairie Math
Students work together to build models of prairie plants. Using the model, they estimate the height and then measure them using metric and standard units. They write a fraction to represent their part of the whole set and compare and...
Curated OER
Shooting Stats
Eighth graders discover the important role statistics play in sports and that appropriate data must be collected to do a statistical analysis. Students practice calculating statistics by charting a professional player of their choice.
Curated OER
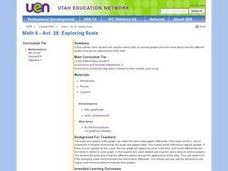
Exploring Scale
Sixth graders discuss how the scale and type of graph can change how the data appears. With a partner, they identify all the information about the graph in a specific amount of time and record them in a journal. To end the lesson plan,...
Curated OER
Determining Liquid Densities
Students practice determining liquid densities in a short, hands-on lab activity. Students use a graduated cylinder to measure out 100 milliliters of a liquid, find its mass using a balance, and record measurements in a data table....


