American Statistical Association
How Fast Are You?
Quick! Snap up the lesson plan. Scholars first use an online app to collect data on reaction times by clicking a button when the color of a box changes. They then plot and analyze the data by considering measures of center, measures of...
Curated OER
PreCalculus Test 3: Angle Measurement
In this angle measurement instructional activity, students identify the domain and range of given problems. They determine the amplitude, period and horizontal translation of given functions. This two-page instructional activity...
Curated OER
Mean, Median and Mode
Young statisians work with sets of data. They find mean, median and mode, and discuss the effects of outliers on the data set.
Curated OER
Range and Measures of Central Tendency
Third graders take notes on a PowerPoint presentation featuring calculating and analyzing data. They practice skills highlighted in the presentation and create a table in Microsoft Excel showing data analysis.
Curated OER
Algebra: Do You See What I See?
Students discover how to find the mean, median, and mode from sets of data. By using statistical techniques such as whisker plots and bar graphs, they display the data gleaned from problems. Individually, students complete projects...
Curated OER
Exercise Those Statistics!
Students participate in various activities, measuring their pulse rates and recording the data. They analyze the statistical concepts of mean, median, mode, and histograms using the data from the cardiovascular activities.
American Institutes for Research
Digital Smiles
Explore metric measurement, recording data, and creating an electronic spreadsheet displaying results with your math class. Scholars will measure the length of their smiles, record the measurements, and represent the results on an...
Curated OER
Measures of Center
In this statistics worksheet, students find mean, median, and mode for 3 problems. They find the mean of summarized data in 2 problems.
Curated OER
Measure & Evaluate Range, Mean, Median, Mode
Students learn mean, median, and mode through setting up a science experiment. In this measures of central tendency instructional activity, students drop a marble into a box with 2 inches of flour and record the data. Students could also...
Power to Learn.com
Survey of Favorites
Upper grade and middle schoolers discuss their favorite TV programs, music, books, etc. Following a instructional activity on measures of central tendency, learners discuss random sampling. They conduct a survey and use charts and...
Curated OER
Integration: Statistics
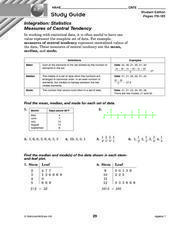
In this math worksheet, students find the mean, median and mode for 6 number sets. Students then find the median and mode for data found in 2 stem-and-leaf plots.
Curated OER
Data Analysis
In this data analysis worksheet, students solve and complete 4 different types of problems. First, they reduce the data provided to find the means, and graph the means in a line graph. Then, students graph the data from each mixture...
Curated OER
Mean, Median, & Mode
Students determine mean, median, and mode. In this problem solving lesson, students evaluate a set of data to determine the mean, median, and mode. Students work in small groups practicing cooperative learning skills as they problem solve.
Curated OER
A Little Average Problem
In this measure of central tendencies worksheet, students are given points scored by one person on a basketball team. They find the number of points scored in the 10th game.
Curated OER
Metric Olympics
Students participate in a Metric Olympics event and use metric measurements to measure actual performances in their events. They throw a plastic straw for a javelin event, participate in a long jump and high jump event, and a variety of...
Curated OER
Connecting Measurement
Students participate in activities the connect measurement to geometry, statistics, estimation, and the real world. They collect measurements from their elbow to the tip of their middle finger and make a box plot of the data as well as...
Curated OER
Quiz: Error in Measurement
In this error in measurement quiz, students read given problems and determine the percent of error, find the absolute error, the relative error, and identify the limits. This one-page learning exercise contains ten problems.
Radford University
Is Fall Normal?
Fine the normality of fall measurements. Pairs collect measurements of fall leaves and one other fall object. Using the measurements, the groups determine the descriptive statistics for the object and using the Empirical Rule, figure out...
Curated OER
Math - Blank Jeopardy
Double Jeopardy! Review polynomials, statistics, triangles, graphing, mode, median, mean, measurement, slope, distance, and ratio. Note: Have everyone use a white board to do the problems to get a quick check on understanding.
Curated OER
What is the Average Height of Your Class?
In this statistics lesson, learners use an on-line form generator create a class-specific form, then complete the form, view a graph and data analysis, and draw conclusions.
Curated OER
Bar Graphs and Histograms
In this bar graphs and histograms learning exercise, students create bar graphs and histograms from given information. They interpret graphs. This one-page learning exercise contains 6 multi-step problems.
Curated OER
Range and Mode Practice 4.5
In this range and mode worksheet, students study a data table that shows the ages of children in a school play. Students solve 5 problems pertaining to the range and mode of the information.
Curated OER
Understanding Statistics
In this statistics worksheet, young scholars examine and interpret pictographs and line graphs. Students analyze the provided data in order to create bar graphs, circle graphs, and box and whisker plots. The nine page worksheet...
Curated OER
Beyond Averages: Median, Mode and Range: Post Test
In this data worksheet, students complete a 10 question multiple choice post test about finding the median, mean, mode and range of a set of data.


