Illustrative Mathematics
Electoral College
A cross-curricular resource that takes the electoral votes and allows your learners to organize and analyze the data. Young voters can determine which states are more influential and interpret the dotplot provided for more data....
Centre for Innovation in Mathematics Teaching
Ten Data Analysis Activities
This thirteen page data analysis worksheet contains a number of interesting problems regarding statistics. The activities cover the concepts of average measurements, standard deviation, box and whisker plots, quartiles, frequency...
Education Development Center
Creating Data Sets from Statistical Measures
Explore the measures of central tendency through a challenging task. Given values for the mean, median, mode, and range, collaborative groups create a set of data that would produce those values. They then critique other answers and...
Teach Engineering
Earthquakes Living Lab: Locating Earthquakes
There are patterns in nearly everything — even earthquakes. Pairs research current earthquakes to see if there are any patterns. They determine the mean, median, and mode of the earthquake data, along with the maximum and...
Noyce Foundation
Through the Grapevine
Teach statistics by analyzing raisins. A thorough activity provides lesson resources for five levels to include all grades. Younger pupils work on counting and estimation, mid-level learners build on their understanding of the measures...
US Department of Commerce
Commuting to Work: Box Plots, Central Tendency, Outliers
Biking may be an outlier. Using data from 10 states on the number of people reporting they bike to work, pupils calculate the measures of center. Scholars determine the range and interquartile range and find which provides a better...
David Pleacher
Candy Math Fun
Few things can motivate children to learn like the promise of a sweet and tasty treat. Given a bag of M&M®s, Skittles®, or other colorful candy, students first predict the contents of the bag before counting the pieces,...
Newspaper Association of America
Power Pack: Lessons in Civics, Math, and Fine Arts
Newspaper in Education (NIE) Week honors the contributions of the newspaper and is celebrated in the resource within a civics, mathematics, and fine arts setting. The resource represents every grade from 3rd to 12th with questions...
Curated OER
Button Bonanza
Collections of data represented in stem and leaf plots are organized by young statisticians as they embark some math engaging activities.
101 Questions
Motivation to Run
Run headlong into a great resource. Young mathematicians explore the Nike+ app to see which measure of central tendency motivates runners the most. They use two screenshots of the app to help them make their determinations.
Michigan State University
In Search of Life
Explore the habitats around you with an activity that takes kids out of the classroom to learn about the local variety of habitats and the living things that call them home. In small groups, scholars investigate their surroundings,...
Illustrative Mathematics
Puppy Weights
Nobody can say no to puppies, so lets use them in math! Your learners will take puppy birth weights and organize them into different graphs. They can do a variety of different graphs and detail into the problem based on your classroom...
TeachEngineering
Teach Engineering: Means, Modes, and Medians
Students experience data collection, analysis and inquiry in this LEGO MINDSTORMS NXT -based activity. They measure the position of an oscillating platform using a ultrasonic sensor and perform statistical analysis to determine the mean,...
Texas Instruments
Texas Instruments: Glencoe Pre Algebra: Graphing Calculator: Mean and Median
Students will find the mean and median of a set of data.
Varsity Tutors
Varsity Tutors: Hotmath: Algebra Review: Mode, Mean and Median
Find a quick, concise explanation of a mode. An example is given and clearly explained. Mean and median are also explained.
Palomar Community College District
Palomar College: Mode, Median, Mean Examples
A series of step-by-step worked problems demonstrating how to take a set of data and produce the measures of central tendency. Hints are provided along the way and the final measures are shown for the user to check.
Shodor Education Foundation
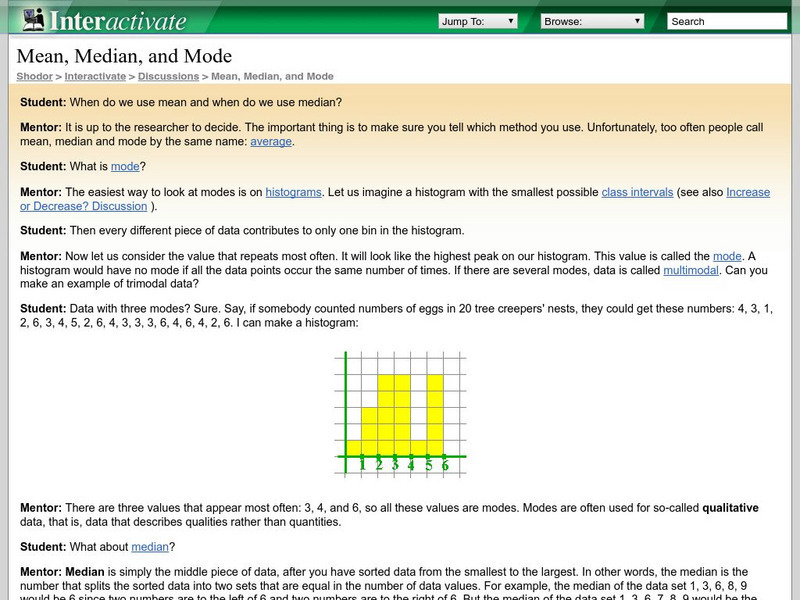
Shodor Interactivate: Mean, Median, and Mode Discussion
This is a virtual discussion between a mentor and student involving mean, median, and mode. Discusses when each is used and how they are found.
Texas Instruments
Texas Instruments: Data and Statistical Methods 1
In this set of exercises, a set of data is provided; students answer questions about mean, median, mode, and quartiles. Questions are multiple choice with solutions provided.
Texas Instruments
Texas Instruments: An Average Lunch?
Students explore the meaning of the average (mean) value for a set of data.
Math Is Fun
Math Is Fun: How to Find the Median Value
This math tutorial provides an explanation of the median value for a groups of numbers.
Math Is Fun
Math Is Fun: How to Find the Mode
This website gives a clear, simple explanation of how to find a mode.
Math Is Fun
Math Is Fun: How to Find the Mean
This math tutorial illustrates the mean of a set of data.
TOPS Learning Systems
Top Science: Tack Toss [Pdf]
An activity where students toss a set of tacks one hundred times and plot how many land on their sides each time. They then calculate the mode, median, and mean.
Rice University
Hyper Stat Online Statistics Textbook: Central Tendency
Click on mean, median, mode, trimean, or trimmed mean to review central tendency.


