EngageNY
Using Tree Diagrams to Represent a Sample Space and to Calculate Probabilities
Cultivate the tree of knowledge using diagrams with two stages. Pupils create small tree diagrams to determine the sample space in compound probability problems. The lesson uses only two decision points to introduce tree diagrams.
Curated OER
Data Analysis, Probability, and Discrete Math
Choose to supplement your probability unit with this resource and you won't be disappointed with the outcome. Teach young mathematicians to organize information using tree diagrams and lists in order to determine the possible outcomes of...
Curated OER
Investigation - Staci's New Car
Students study a shopping problem. They discuss strategies for determining the number of possible choices. They create a tree diagram and an organized list. Students analyze patterns and derive an equation for the multiplication principle.
EngageNY
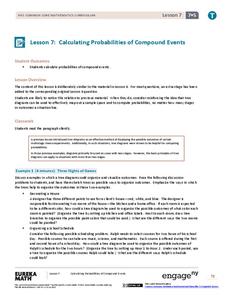
Calculating Probabilities of Compound Events
Use tree diagrams with multiple branches to calculate the probabilities of compound events. Pupils use tree diagrams to find the sample space for probability problems and use them to determine the probability of compound events in the...
Curated OER
Investigation - Staci's New Car
Sixth graders solve math combination problems. In this combination problem solving lesson, 6th graders participate in a teacher led session in which they use tree diagrams and organized lists to determine all of the possible combinations...
Scholastic
Study Jams! Combinations
With so many combinations, this colorful video allows your learners to mathematically figure out how many options they have when purchasing t-shirts. One instructional activity teaches how to find out the combinations, and the second...
Alabama Learning Exchange
Probability with Tree Diagrams
Middle school math whizzes view a PowerPoint tutorial on tree diagrams. Using "Anthonio's Pizza Palace," an interactive activity involving the selection of pizza toppings, they use Pascal's triangle as a tree diagram. This is an...
Virginia Department of Education
Middle School Mathematics Vocabulary Word Wall Cards
Having a good working knowledge of math vocabulary is so important for learners as they progress through different levels of mathematical learning. Here is 125 pages worth of wonderfully constructed vocabulary and concept review cards....
Actis
Handling Data: Probability, Tree Diagrams
Clean, but captivating, two online simulations demonstrate probability for middle schoolers. They can choose the number of coins and tosses and watch as the results pile up. They can choose from a variety of spinner types and the number...
Noyce Foundation
Double Down
Double the dog ears, double the fun. Five problems provide increasing challenges with non-linear growth. Topics include dog ears, family trees and population data, and geometric patterns.
Code.org
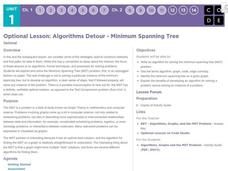
Algorithms Detour - Minimum Spanning Tree
This optional lesson plan introduces the class to the idea of a minimum spanning tree. The activity focuses on determining an algorithm that will find the most efficient path in a network to transfer data.
Curated OER
Choices! Choices! Choices!
Students explore the Fundamental Counting Principle and tree diagrams. In this secondary mathematics lesson, students choose three pictures of clothing forma a catalog and create as many outfits as possible. Students then use...
Curated OER
Data Management and Probability: Applications
In this data management and probability applications worksheet, 7th graders solve 13 different types of problems that include finding the mean, median, mode, and range of each set of values, as well as, solving a number of word problems....
Los Angeles County Office of Education
Assessment For The California Mathematics Standards Grade 6
Test your scholars' knowledge of a multitude of concepts with an assessment aligned to the California math standards. Using the exam, class members show what they know about the four operations, positive and negative numbers, statistics...
Math Learning Center
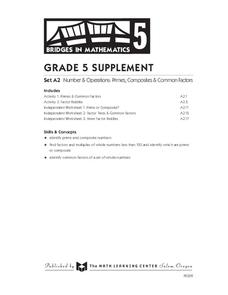
Grade 5 Supplement Set A2 – Number and Operations: Primes, Composites and Common Factors
Incorporate riddles into your math lesson by having students make tree factors and determine if the number is a prime or composite. They will also use other clues to find the answer to the riddle while sharpening their...
Missouri Department of Elementary
Fly Your Kite
Encourage scholars to become a productive community member with a kite-themed lesson plan. Following a review and discussion, learners complete a Venn diagram that displays the connection between character traits needed to make a home...
Curated OER
Reading Trees: Understanding Dendrochronology
Students examine tree-ring dating and discuss the lack of water the settlers in Jamestown faced. They create paper tree rings, simulate rain patterns, and describe the history of construction paper tree sequences.
Curated OER
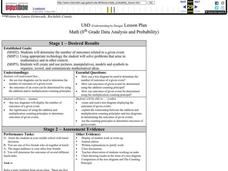
Grade Data Analysis and Probability
Eighth graders display the outcome of given events by creating and reading tree diagram. They explain the relationship between addition and multiplication.
Mathematics Vision Project
Module 8: Probability
It's probably a good idea to use the unit. Young mathematicians learn about conditional probability using Venn diagrams, tree diagrams, and two-way tables. They also take into consideration independence and the addition rules.
Mathematics Vision Project
Probability
Probability, especially conditional probability, can be a slippery concept for young statisticians. Statements that seem self-evident on the surface often require a daunting amount of calculations to explicate, or turn out to be...
Pennsylvania Department of Education
Adding and Subtracting Rational Numbers to Solve Problems
Students explore the concept of probability. In this probability lesson, students use area to determine probability. Students use charts and spinners to help determine the probability of events such as flipping a coin or...
NY Learns
Investigation - What's in the Bag?
If you have or can create a set of tiles, numbered one through eight, then you can implement this hands-on lesson about probability models. Individuals draw a tile from a bag, record its number, and then return it to the bag. They...
University of Nottingham
Modeling Conditional Probabilities: 2
Bring the concept of conditional probability alive by allowing your classes to explore different probability scenarios. Many tasks have multiple solutions that encourage students to continue exploring their problems even after a solution...
Curated OER
Math Combinations
Learners examine how to use lists, tables, and tree diagrams to solve math combinations. They create various combinations of outfits using clothing manipulatives, watch an episode of the PBS series Cyberchase, and play an interactive...


