Balanced Assessment
Rolling Coins
What caused the extra rotation? Class members visualize a coin rolling around the circumference of another coin. They determine the reason the rolling coin rotates twice. Further questions require them to determine a generalized formula...
Illustrative Mathematics
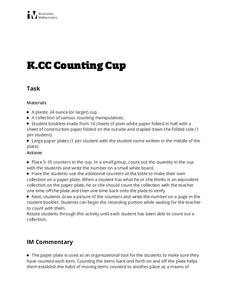
Counting Cup
Help your kindergartners develop counting skills using a 24 oz. plastic cup, counting manipulatives, and a paper plate. Start with a small group of learners and place a quantity of counting objects between the range of 5 to 10 into each...
Illustrative Mathematics
Heads or Tails
Heads! A great way to practice probability is to flip a coin in class. The provided data allows your mathematicians to predict the probability of heads in ten coin flips. Bring coins to class and allow your own trial of heads or tails....
Curated OER
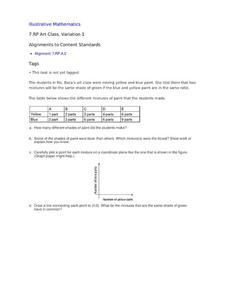
Art Class, Variation 1
Student statisticians calculate ratios to determine how many shades of green were mixed by Ms. Baca's art class. They graph the number of blue parts against the number of yellow parts for each combination and discover that some produce...
Balanced Assessment
Egyptian Statue
Investigate the proportional relationships of length, area, and volume. Learners use the dimensions of rectangular prisms to create ratios and proportions. They compare the different ratios to solve more advanced problems.
Illustrative Mathematics
Modeling London's Population
Looking at London's population from 1801–1961 in 20 year increments, high school mathematicians determine if the data can be modeled by a given logistic growth equation. They explain their thinking and determine the values of each...
Illustrative Mathematics
Voting for Two, Variation 4
After elections, the total amount of votes is not specified but the ratio of votes is. Your learners' job is to determine the fraction of votes John received above half of all votes. The problem can be solved abstractly or by other...
Illustrative Mathematics
Rolling Dice
Rolling dice is a great way for your mathematicians to get a hands-on approach to probabilities. Use the chart to record whether they rolled a six during ten attempts. Calculate results individually (or in small groups) and then record...
Curated OER
Election Poll, Variation 2
When a random sample isn't enough, your math class can compare the data from a physical simulation to decide if the probability is still likely. The lesson plan is part of a probability series that focuses on one question and different...
Curated OER
Election Poll, Variation 3
Build on probability and incorporate a random number generator to select outcomes for a school election. Your learners will record their results on a dot plot and answer questions regarding whether their candidate has a chance at the...


