EngageNY
Sampling Variability and the Effect of Sample Size
The 19th installment in a 25-part series builds upon the sampling from the previous unit and takes a larger sample. Pupils compare the dot plots of sample means using two different sample sizes to find which one has the better variability.
EngageNY
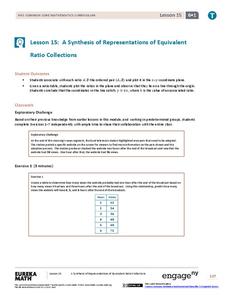
A Synthesis of Representations of Equivalent Ratio Collections
Make all the ratio representations fit together. The 15th segment in a series of 29 presents ratio problems to solve. Scholars use a variety of representations to respond to the questions. The problem set has pupils show how the...
EngageNY
Writing and Evaluating Expressions—Exponents
Bring your young mathematicians into the fold. Scholars conduct an activity folding paper to see the relationship between the number of folds and the number of resulting layers in the 23rd installment of a 36-part module. The results of...
EngageNY
End-of-Module Assessment Task: Grade 8 Module 4
Connect proportional linear equations and systems. The seven-question assessment is the last installment in a 33-part series. The items cover comparing proportional relationships, slope concepts, and simultaneous linear equations. To...
EngageNY
Ratios of Fractions and Their Unit Rates 2
Remodeling projects require more than just a good design — they involve complex fractions, too. To determine whether a tiling project will fit within a given budget pupils calculate the square footage to determine the number of tiles...
Curated OER
Art Class, Variation 2
Given a set of six paint mix ratios, artistic mathematicians produce an equation that relates the number of parts for blue paint to parts for yellow paint resulting new shades of green.
Inside Mathematics
Snakes
Get a line on the snakes. The assessment task requires the class to determine the species of unknown snakes based upon collected data. Individuals analyze two scatter plots and determine the most likely species for five additional data...
Noyce Foundation
Truffles
Knowing how to scale a recipe is an important skill. Young mathematicians determine the amount of ingredients they need to make a certain number of truffles when given a recipe. They determine a relationship between ingredients given a...
Inside Mathematics
Expressions
Strive to think outside of the quadrilateral parallelogram. Worksheet includes two problems applying prior knowledge of area and perimeter to parallelograms and trapezoids. The focus is on finding and utilizing the proper formula and...
Curated OER
Foxes and Rabbits 3
Use realistic data to find trigonometric models that best fit the populations of foxes and rabbits in a national park. Included are detailed explanations of the answers and process. This is a follow-up exercise to the lesson listed in...
Illustrative Mathematics
The Price of Bread
As part of an initiative to strengthen our young adults' financial understanding, this problem explores the cost of bread and minimum wage since the 1930s. Learners are asked to find the percent increase from each year and compare it...
Inside Mathematics
Squares and Circles
It's all about lines when going around. Pupils graph the relationship between the length of a side of a square and its perimeter. Class members explain the origin in context of the side length and perimeter. They compare the graph to the...
Curated OER
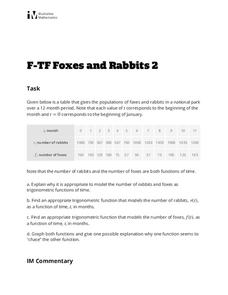
Foxes and Rabbits 2
Explore the relationship between the population of foxes and rabbits in a national park using trigonometric models. Plot data and find the appropriate trigonometric functions. Two questions require interpretation and explanation of...
Illustrative Mathematics
Fruit Salad
Playing with values in this fruit salad problem allows learners to find out how many cherries were mixed in. Your middle schoolers can organize their thoughts in a chart before going into the equation. Eigth graders can skip the chart...
Inside Mathematics
Graphs (2006)
When told to describe a line, do your pupils list its color, length, and which side is high or low? Use a worksheet that engages scholars to properly label line graphs. It then requests two applied reasoning answers.
Mathed Up!
Stratified Sampling
Young mathematicians learn how to solve problems involving stratified sampling. They review concepts of sampling and proportionality by watching a video and then they complete a learning exercise of questions on this topic.
Illustrative Mathematics
Buying Protein Bars and Magazines
Packing for a trip? This activity allows learners to decide how many magazines and protein bars they can buy with twenty dollars. They can organize their work in a chart to track how many items they can purchase. There are two different...
Curated OER
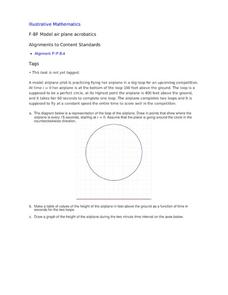
Model Air Plane Acrobatics
Your young airplane enthusiasts will enjoy this collaborative task of graphing an airplane's distance from the ground as it flies in a perfect circle. They will discover that they have graphed a sinusoidal function that comes from the...
Illustrative Mathematics
Shake and Spill
Entertaining as well as educational, this math activity about decomposing numbers is bound to capture the engagement of young learners. Given a cup and five two-color counters, young mathematicians simply shake and spill the cup,...
Curated OER
The Canoe Trip, Variation 2
The behavior of a rational function near a vertical asymptote is the focus around this trip up a river. Specifically, numerical and graphical understanding is studied. The canoe context pushes the variables as numbers, rather than as...
Curated OER
In the Billions and Exponential Modeling
Modeling population growth gives learners an opportunity to experiment with real data. Comparing the growth rates in this real-life task strengthens learners' understanding that exponential functions change by equal factors over equal...
Curated OER
Valentine Marbles
if you've ever had to guess how many items were in a jar, then this problem is for you! With a big jar full of red and white marbles, does picking a sample of 16 allow your learners to get a good estimate on the percentages of each...
Illustrative Mathematics
Growing Bean Plants
Plant growth experiments offer rich, cross-curricular learning opportunities that can really excite and engage young learners. In this series, children work in pairs planting, measuring, and comparing the height of bean plants in order...
Curated OER
Compounding with a 5% Interest Rate
The balance in an account continuously compounding interest is the context of this engaging task. Your young accountants will investigate the ending balance in an account as they compound the interest more and more. Learners write the...


