Curated OER
M & M Madness
Students work with the mathematics unit of collection, organization, and presentation of data. In this math and technology lesson plan, students use Valentine M & M’s and The Graph Club to sort and graph the various colored M & M’s.
Curated OER
Cold, Clouds, and Snowflakes
Students explore satellite data and graphing. In this weather data analysis math and science lesson, students analyze NASA satellite data to draw conclusions about geographical areas where precipitation might have happened. Students...
Curated OER
Are You Full of Hot Air?
Explore the concept of measuring and recording circumference. In this physical science and measurement lesson, young learners blow up balloons, measure the circumference, and record the data on an interactive graphing website.
Curated OER
Jellybean Graphs
Second graders predict and graph data based on the color of jelly beans they think are in a handful. In this prediction lesson plan, 2nd graders will predict how many of each color jellybean are in a handful. Then they graph these...
Curated OER
Graphing Family Reading Habits
Second graders collect data from their families about their reading habits and graph them. In this graphing family reading habits lesson, 2nd graders interview family members about their reading habits. They then use a graphing computer...
Curated OER
Graphing Using Excel
Fifth graders complete a series of graphs by gathering information and using Excel to graph the information. In this graphing lesson, 5th graders graph favorite desserts of the class. Student put their results into the...
Curated OER
The Solar Cycle
Students research the solar cycle. In this Science lesson, students use the internet to investigate the solar cycle. Students produce a spreadsheet and graph from the information collected.
Curated OER
Gummy Bear Math
First graders predict, collect data, and create a graph based on gummy bear colors they are given. For this graphing lesson plan, 1st graders first predict how many colors of gummy bears there are. They then count the colors, graph them,...
Curated OER
Marvelous Mathematics
Students make a table on the computer, but create fractions and equivalent fractions through the use of color. They are able to manipulate fractions in order to gain a greater understanding of the meaning of whole number that is broken...
Curated OER
Collecting Data and Graphing
Eighth graders, in groups, count the different colors of M&M's in each kind of package and then draw a pictograph to show the results. Each group writes a program to show their results and then compare the manually-drawn and computer...
Curated OER
Gingerbread Man Math
Students collect and explore gingerbread man data. In this math and technology lesson plan, students examine how to organize and interpret data in three formats: objects, pictures, and graphs.
Curated OER
Is the Hudson River Too Salty to Drink?
Students explore reasons for varied salinity in bodies of water. In this geographical inquiry lesson plan, students use a variety of visual and written information including maps, data tables, and graphs, to form a hypothesis as to why...
Curated OER
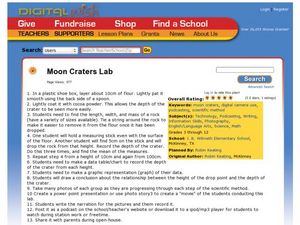
Moon Craters Lab
Learners explore characteristics of mass. In this scientific inquiry about mass lesson plan, students drop rocks of different weights from various heights and record the depth of the "crater" created. Learners record their findings...
Curated OER
M & M Madness
Second graders graph M & M's by color. In this graphing lesson plan, 2nd graders first predict how many of each color they think are in a handful of M & M's. Then they graph the amounts of each color on a computer program....
Curated OER
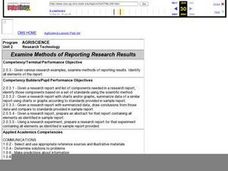
Examine Methods of Reporting Research Results
Students analyze a research report and the list of components needed in a research report and then identify those components based on a set of standards using the scientific method. They collect data which can be used for a graphical...
Curated OER
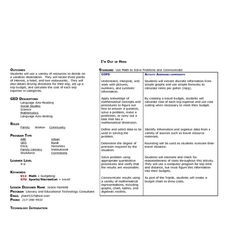
I'm Out of Here
Students create a travel budget. In this budget lesson, students research vacation destinations. Working independently, students research destinations on the Internet and construct a budget for the vacation. Resources provided.
Curated OER
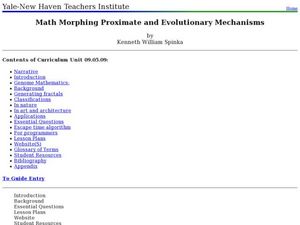
Math Morphing Proximate and Evolutionary Mechanisms
Students identify the different types of fractals. In this geometry lesson, students use math to analyze different biological phenomena. They collect data from the experiments and construct graphs.
Curated OER
Phenomenal Weather-Related Statistics
Eighth graders research, collect and interpret data about weather statistics. They record that data on spreadsheets. they create Powerpoint presentations on their individual or group research.
Curated OER
Keypals and You
Students collect and compare data received from keypals. They use electronic mail to exchange information with keypals and rrite a paper comparing similarities and differences between themselves and their keypals. In addition, use a...
Curated OER
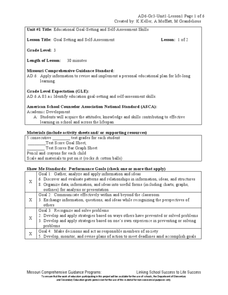
Goal Setting and Self-Assessment
Third graders review the importance of good study habits as a skill necessary for success in school. They focus on their goals and discuss how this would help to improve grades. They determine how much an F weighs their grade down.
Curated OER
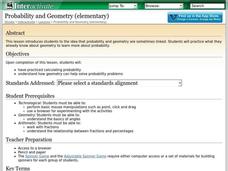
Probability and Geometry
Learners examine the relationship between probability and geometry to solve problems. In this geometry and probability lesson, students investigate the effect of changing percentages on a spinner to the probability of landing on a...
Curated OER
Oil and its Everyday Uses
Explore the properties of oil through an experiment. They use the scientific process to investigate oil, participate in experiments, watch videos,and use information from the internet to determine how oil has changed our...
Curated OER
Patterns Here, There, and Everywhere!
Upper graders access the Microsoft Word program and create patterns by utilizing certain keys on the keyboard. They create picket fences, smiley faces, and hearts. It seems that this lesson has as much to do with keyboarding skills as it...
Curated OER
The Nutrients Public Transportation System
Students investigate the human circulatory system by experimenting with hoses. In this human body lesson, students create a system of hoses simulating the circulatory system which they utilize to pass objects through....


