For the Teachers
$1 Math
Captivate your class by having them find the value of their names, different zoo animals, musical instruments, etc.,with a mental math lesson. Using the coding formula listed, children learn to fluently estimate and calculate...
Curated OER
Using a Calculator
Learners use a calculator to solve math problems. In this calculator usage lesson, students get into pairs and familiarize themselves with the keys. Learners are then given problems to solve using the calculator. Students do Smart Board...
Curated OER
Measures of Central Tendency Using Scientific Calculators
Learners explore mean, median, and mode as they model mathematics in real-world problem situations. The lesson plan requires the use of the TI 30X IIS.
Curated OER
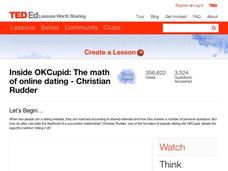
Inside OKCupid: The Math of Online Dating
Capture the hearts of your young statisticians with this real-life example of using statistics in online dating. The use of average and geometric mean are discussed in the context of creating the algorithm used to connect people.
Virginia Department of Education
Calculating Measures of Dispersion
Double the fun — calculate two measures of deviation. The lesson plan provides information to lead the class through the process of calculating the mean absolute deviation and the standard deviation of a data set. After learning how to...
EngageNY
Using Linear Models in a Data Context
Practice using linear models to answer a question of interest. The 12th installment of a 16-part module combines many of the skills from previous lessons. It has scholars draw scatter plots and trend lines, develop linear models, and...
Curated OER
Math Can Be Electrifying
Students explore how math can be used to calculate and analyze how electricity causes air pollution. Students design a campaign to educate family members on ways they can save electricity. They create a graph that compares two electric...
EngageNY
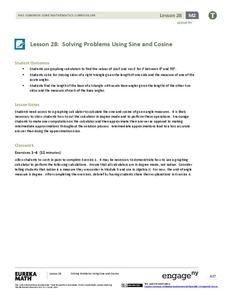
Solving Problems Using Sine and Cosine
Concepts are only valuable if they are applicable. An informative resource uses concepts developed in lessons 26 and 27 in a 36-part series. Scholars write equations and solve for missing side lengths for given right triangles....
EngageNY
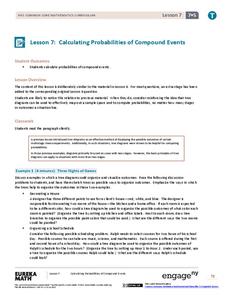
Calculating Probabilities of Compound Events
Use tree diagrams with multiple branches to calculate the probabilities of compound events. Pupils use tree diagrams to find the sample space for probability problems and use them to determine the probability of compound events in the...
EngageNY
Solving Area Problems Using Scale Drawings
Calculate the areas of scale drawings until a more efficient method emerges. Pupils find the relationship between the scale factor of a scale drawing and the scale of the areas. They determine the scale of the areas is the square of the...
Illustrative Mathematics
How Thick Is a Soda Can I?
The humble soda can gets the geometric treatment in an activity that links math and science calculations. After a few basic assumptions are made and discussed, surface area calculations combine with density information to develop an...
Sea World
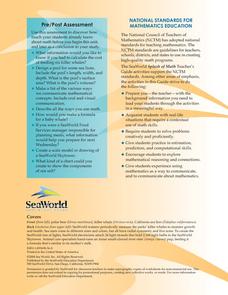
Splash of Math
How can kids use math to learn about marine life? Combine math skills with science lessons in a resource featuring activities about life in the sea. Kids graph and calculate data, solve complex word problems, measure geometric shapes,...
EngageNY
Comparison of Numbers Written in Scientific Notation and Interpreting Scientific Notation Using Technology
Examine numbers in scientific notation as a comparison of size. The 14th lesson in the series asks learners to rewrite numbers as the same power of 10 in scientific notation to make comparisons. Pupils also learn how to use a calculator...
Georgia Department of Education
Math Class
Young analysts use real (provided) data from a class's test scores to practice using statistical tools. Not only do learners calculate measures of center and spread (including mean, median, deviation, and IQ range), but...
EngageNY
Making Scale Drawings Using the Ratio Method
Is that drawn to scale? Capture the artistry of geometry using the ratio method to create dilations. Mathematicians use a center and ratio to create a scaled drawing. They then use a ruler and protractor to verify measurements.
Illustrative Mathematics
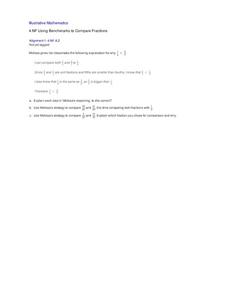
Using Benchmarks to Compare Fractions
Introduce a new strategy for comparing fractions by analyzing Melissa's use of benchmarks. Walk the class through her process, calling on students to explain their understanding of each step she took. Then practice this method on two...
Virginia Department of Education
Radical Equations
Provide students with the skill for how to examine algebraic and graphical approaches to solving radical equations. Learners solve various radical equations involving square root and cube root expressions. They first solve...
Virginia Department of Education
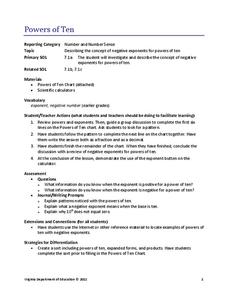
Powers of Ten
Investigate negative exponents of-ten. Pupils use the pattern of increasing powers of 10 to determine negative powers of 10. The scholars write the powers in expanded and product forms and make the connection to exponents using a...
EngageNY
Systems of Equations Leading to Pythagorean Triples
Find Pythagorean Triples like the ancient Babylonians. The resource presents the concept of Pythagorean Triples. It provides the system of equations the Babylonians used to calculate Pythagorean Triples more than 4,000 years ago. Pupils...
Curated OER
Data Analysis Using Technology
Analyze data using technology. Middle schoolers design data investigations, describe data, and draw their own conclusions. Then they select the best type of graph, graph and interpret the data, and look for patterns in trends. They also...
Council for Economic Education
Calculating Simple Interest
How much is owed? A calculated resource introduces the simple interest formula with a video that describes how to use it. Classmates then show what they know by answering questions within a simple interest worksheet.
EngageNY
Using Tree Diagrams to Represent a Sample Space and to Calculate Probabilities
Cultivate the tree of knowledge using diagrams with two stages. Pupils create small tree diagrams to determine the sample space in compound probability problems. The lesson uses only two decision points to introduce tree diagrams.
EngageNY
Describing Distributions Using the Mean and MAD
What city has the most consistent temperatures? Pupils use the mean and mean absolute deviation to describe various data sets including the average temperature in several cities. The 10th lesson in the 22-part series asks learners to...
EngageNY
Using Sample Data to Compare the Means of Two or More Populations II
The 23rd segment in a series of 25 presents random samples from two populations to determine whether there is a difference. Groups determine whether they believe there is a difference between the two populations and later use an...


