CK-12 Foundation
Variance of a Data Set
Use variable value sliders to understand variance. The interactive shows four whole numbers, their mean and deviation. Using the information, pupils find the variance of the numbers and respond to question related to the understanding of...
Curated OER
Cricket 2007
In this math and sports worksheet, students read and review the statistics from the performance of teams in the Cricket World Cup. They identify which team played the most matches and who won the most. Students also compare the...
Curated OER
Shooting Stats
Eighth graders discover the important role statistics play in sports and that appropriate data must be collected to do a statistical analysis. Students practice calculating statistics by charting a professional player of their choice.
Curated OER
Time For Breakfast
This unit encourages students to assess the validity of a set of statements and then plan and carry out investigations to find out whether the statements are true. Students then carry out statistical investigations of their own.
Curated OER
Compare Your Air
Middle schoolers will compare the data for different locations that they select and investigate trends over the course of a number of years. This will give the students an opportunity to apply statistical measures (mean, median,mode) to...
Curated OER
A Statistical Study on the Letters of the Alphabet
Students use a book or magazine to research the use of letters. They complete a worksheet and compare their results.
Curated OER
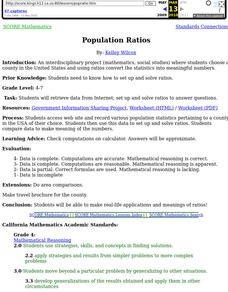
Population Ratios
Students access web site and record various population statistics pertaining to a county in the USA of their choice. They use this data to set up and solve ratios. They compare data to make meaning of the numbers.
Curated OER
Sculptural Statistics
Students conduct an experiment to determine the frequency of pulling various parts of an ancient Greek sculpture out of a hat.
Curated OER
Fire Fighting Crew
Students use the concepts in statistics to make decisions. They calculate the mean, median and mode. They compare one firefighter against another and analyze the data. They share their information with the class.
Curated OER
A RealSim Surface Look at Descriptive Statistics
Learners explore the concepts of mean and variance. They observe properties of materials to their basic atomic or molecular structure. Students use spreadsheet software to record, tabulate and analyze collected information.
Curated OER
What I Didn't Know...
High schoolers practice creating wikis. In this wiki instructional activity, students create a wiki about any math topic that they know nothing about. High schoolers learn about their topic and create a wiki that explains the math topic...
Curated OER
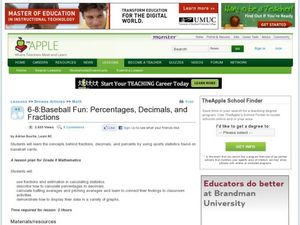
6-8 Baseball Fun: Percentages, Decimals, and Fractions
Young scholars practice the concepts behind fractions, decimals, and percents by using sports statistics on baseball cards. In this baseball math instructional activity, students use fractions and estimation to calculate statistics....
Curated OER
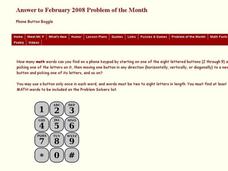
Phone Button Boggle
In this phone button boggle worksheet, students identify the number of math words they can find on a phone keypad according to given directions. This one-page worksheet contains one problem. Answers are provided.
Curated OER
Box Plots on the TI-83 Calculator
Eighth graders research box plots on the Internet. They gather real life statistics and analyze the collected statistics by making multiple box plots on the TI-83 calculator.
Curated OER
It All Adds Up
Students brainstorm reasons for politicians to expand recycling programs and find statistics to support recycling programs. They design posters, displaying a compelling statistic about recycling, to convince students at their school to...
Curated OER
Statistical Analysis of Data by Gender
Students examine and identify gender bias, stereotyping, and discrimination in school materials, activities, and classroom instruction. They apply descriptive statistics knowledge to real-world data.
Other popular searches
- Football Math Statistics
- Baseball Math Statistics
- Math Statistics Simulation
- Math Statistics Survey
- Math Statistics Lesson
- Games Math Statistics
- Math Statistics Histograms
- Sneeze Math Statistics
- Saxon Math Statistics
- Statistics Math Project
- Jeopardy Math Statistics
- Math Statistics Correlation

