Curated OER
Historical Climate Statistics
Are we getting hotter? Let’s look at a sample locality where historical records exist and see what we can find out. Here is an activity that has young environmentalists plotting the average winter temperature in England from 900-1900. It...
Curated OER
Data Analysis: Graphs, Charts, Tables, Statistics
In this data analysis worksheet, students interpret data in 5 problems involving graphs, tables, and scatterplots. Students construct 1 stem and leaf plot and find the mean, median, and mode of a data set.
Curated OER
Infusing Equity Vs Gender into the Classroom
Students explore the effect of gender bias in the classroom. In this statistics lesson, students discuss the effects of stereotyping, discrimination, and gender bias in the classroom. They collect data on different work places dealing...
Curated OER
Math Lesson: What Do You Want to Know? - Country Statistics
Students are able to identify the characteristics of a variety of graphs (i.e. bar graph, line graph, pie graph, scatter plot, population pyramids, etc.) They recognize how the type of data to be presented plays a role in choosing the...
Curated OER
Recipe For Disaster
Students play an interactive game online to learn ratios. In this statistics lesson, students solve problems in an online game about ratio and relating statistics to the real world. This lesson provides hands on as well as teaching time.
Curated OER
Chain Letters and Pyramid Schemes
In this statistics lesson, high schoolers analyze chain letters and draw conclusions of the outrageous amount of letters that would be mailed out if people really followed through. This is more of a thought provoking learning exercise...
Curated OER
Scatter Plots
In this statistics worksheet, 11th graders analyze different scatter plot graphs for positive, negative and no correlation. They graph their data and analyze it using scatter plots.There is 1 question with an answer key.
Curated OER
Combinations and Permutations
In this statistics worksheet, learners solve the probability of an event occurring using probability, permutation and combination. There are 17 questions with an answer key.
Curated OER
New York State Mathematics Exam
For this math worksheet, students review for the exam given by the state of New York. There are 16 pages and 27 questions in this booklet covering topics from algebra, geometry and statistics.
Curated OER
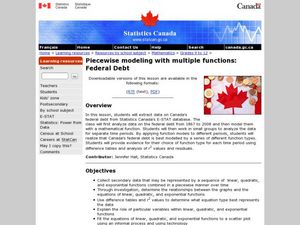
Piecewise Modeling with Multiple Functions: Federal Debt
Young scholars analyze data on debt and write an equation. In this statistics lesson, students are given data from different time periods, and are asked to graph and analyze the data. They work in groups, and are assigned different parts...
Curated OER
Math Vocabulary Words
In this math vocabulary worksheet, learners read 14 math vocabulary words relating to statistics and graphs. This would be an excellent tool for teachers to create a math vocabulary word wall. Teachers could use these labels...
Curated OER
Statistics
In this statistics worksheet, 7th graders solve and complete 5 different problems related to determining various statistics. First, they find the average of a given set of numbers. Then, students find the median and mode of each set of...
Curated OER
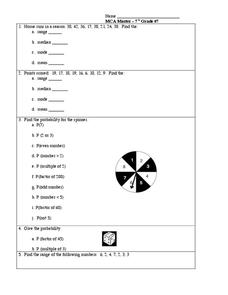
Probability and Statistics
In this probability and statistics worksheet, students complete 5 problems regarding range, mean, median, mode, and a spinner probability problem.
Curated OER
Lesson Plan: The Math of Removal
Students consider the plight of those who walked the Trial of Tears. In this Indian Removal lesson, students compare statistics regarding Indian survival rates.
EngageNY
Sampling Variability and the Effect of Sample Size
The 19th installment in a 25-part series builds upon the sampling from the previous unit and takes a larger sample. Pupils compare the dot plots of sample means using two different sample sizes to find which one has the better variability.
Virginia Department of Education
Normal Distributions
Pupils work to find probabilities by using areas under the normal curve. Groups work to calculate z-scores and solve real-world problems using the empirical rule or tables.
Beyond Benign
The Big Melt: Arctic Ice Caps
Are the Arctic ice caps really melting out of existence? Junior climatologists examine the statistics of ice decline through four math-based lessons. Each activity incorporates data, climate information, and environmental impact into an...
Curated OER
Voter Turnout
Explore politics by analyzing the voting process. Pupils discuss the purpose of casting votes in an election, then examine graphs based on the data from a previously held election's turnout. The lesson concludes as they answer study...
Curated OER
Averages: Mean, Median, Mode
After reviewing the process of finding the mean, median, mode, and average of a given data set, learners work through several practice problems. There are five problems related to mode, and five related to finding the mean. Great as...
CK-12 Foundation
Stratified Random Sampling: An Extracurricular Study
Learning isn't a random process. A well-designed interactive lesson helps classes make key conclusions about stratified random sampling. They calculate group percentages and use those percentages to decide on sampling totals.
Radford University
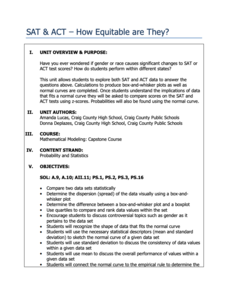
SAT and ACT – How Equitable Are They?
Test the test takers' knowledge of statistics about data from the SAT and ACT tests. Future collegians explore the idea of gender and racial bias in high-stakes college admissions exams. They analyze historical data on average scores by...
Radford University
Is Fall Normal?
Fine the normality of fall measurements. Pairs collect measurements of fall leaves and one other fall object. Using the measurements, the groups determine the descriptive statistics for the object and using the Empirical Rule, figure out...
US Department of Commerce
Make Data Speak
Data displays are more than just a bunch of numbers. Small groups access census results and create eye-catching data displays. Teams choose a statistic and collect data points for five locations. Classmates present their infographics to...
Noyce Foundation
Gym
Give the class a mental work out with an assessment task in which young mathematicians compare several gym membership options. They use substitution to calculate the cost for given numbers of months.
Other popular searches
- Football Math Statistics
- Baseball Math Statistics
- Math Statistics Simulation
- Math Statistics Survey
- Math Statistics Lesson
- Games Math Statistics
- Math Statistics Histograms
- Sneeze Math Statistics
- Saxon Math Statistics
- Statistics Math Project
- Jeopardy Math Statistics
- Math Statistics Correlation


