Hi, what do you want to do?
Curated Video
Fishing for Probability of a Set
Join Fisherman Taylor as she shares examples of probability events that are certain, impossible, likely, equally likely and unlikely to happen. I use fish to demonstrate each example.
Anywhere Math
Probability
The probability is high that your class loves an informative video lesson. The lesson begins with a discussion of vocabulary related to probability and acceptable ways to present a probability. The presenter wraps up the instruction with...
Anywhere Math
Independent and Dependent Events
Some learners are independent, while others are dependent on lessons like these! An instructional video discusses the difference between independent and dependent events when calculating a probability. The lesson begins with...
Corbett Maths
Frequency Trees
It's time to branch out a little! Individuals explore the usefulness of a frequency tree when organizing data in a helpful video lesson. The instruction includes constructing a frequency table from a description and then using the tree...
Anywhere Math
Three-Dimensional Figures
Who knew there were so many parts to a geometric solid?! Well, you probably did, and your pupils will, too, after watching a video lesson on three-dimensional figures. Instruction includes a description of the parts of solids, naming...
Khan Academy
Introduction to Interest, Interest and Debt, Finance and Capital Markets
Here is a simple tutorial on the difference between simple and compound interest. In it, Sal describes interest and defines the vocabulary of principle and interest rate. He also models the amount of money owed under the different...
Crash Course
Mean, Median, and Mode: Measures of Central Tendency: Crash Course Statistics #3
If you have two feet, you have more than the average number of feet! Explore the meaning of the numbers of measures of central tendency of different data sets with the third of five lessons in a video statistics playlist. Using unique...
Crash Course
Measures of Spread: Crash Course Statistics #4
Sometimes the measures of center don't give us enough information. The spread of the data can tell statisticians much more about the data set. A video lesson, part of a statistics video series, describes different measures of spread such...
Crash Course
Fitting Models Is like Tetris: Crash Course Statistics #35
Different statistical models tell people unique information about data. The 35th lesson in the Crash Course Statistics series describes two different statistic models: ANOVA and Repeated Measures ANOVA. The narrator of a short video...
Crash Course
What Is Statistics: Crash Course Statistics #1
Statistics in the wrong hands can be a dangerous thing. The first installment of a five-episode series explains the basics of statistics. The instructor focuses on the usefulness of statistics and how to identify misuse of stats.
Virtual Nerd
Virtual Nerd: What Is Probability?
In math, when you talk about the chance of an event occurring, you are talking about probability. Watch this tutorial for a full explanation. [5:17]
Virtual Nerd
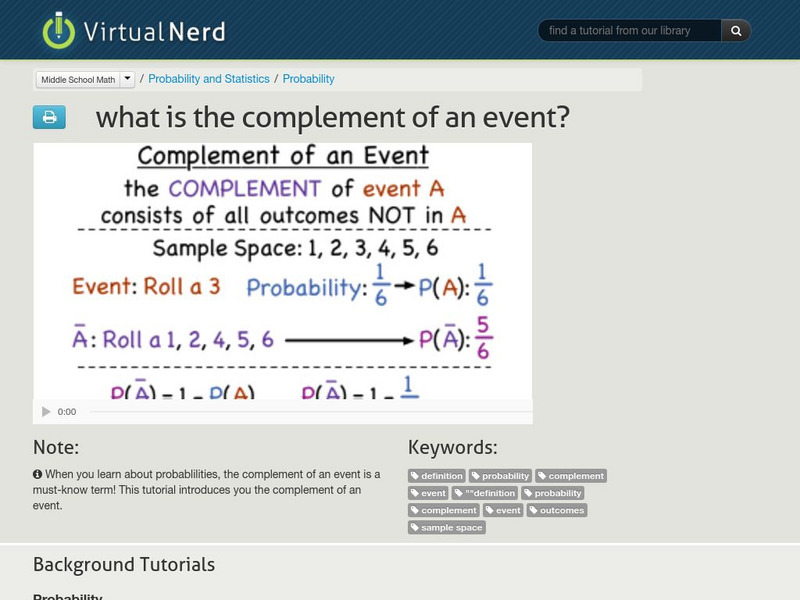
Virtual Nerd: What Is the Complement of an Event?
To understand complementary events, watch this video that explains the term along with examples. [4:53]
Virtual Nerd
Virtual Nerd: What Is an Outcome?
The outcome of an experiment is any possible result. Watch this tutorial for an explanation and an example using dice. [2:09]
Virtual Nerd
Virtual Nerd: What Is the Mean of a Data Set?
Mean is the same thing as average when referring to a set of data. Watch this tutorial for an explanation and example. [4:05]
Virtual Nerd
Virtual Nerd: What Is a Line Plot?
A line plot is an effective way to visualize data. Watch this video for an explanation of line plots along with examples. [4:44]
Virtual Nerd
Virtual Nerd: What Is a Permutation?
Permutations are arrangements of distinct objects where ORDER MATTERS. Watch the following video for and explanation and examples. [4:24]


