Curated OER
Worksheet 2
In this math worksheet, students plot the course for a ship traveling from one point to another using two Cartesian coordinates. Then they plot the vector of the course.
Curated OER
It's a Drag!
Young scholars create number lines using decimals and whole numbers. In this algebra lesson, students graph and solve linear equations. They plot ordered pairs on a coordinate plane correctly.
Curated OER
A Place In Space
Students work together to create a 3D coordinate system. They plot points that are given to them and asked to find these points in space. They discover how engineers use coordinates in their careers.
Curated OER
Worksheet 25
In this math worksheet, students state the Fundamental Theorem of Calculus. Then they evaluate the functions and test them against the theorem.
Curated OER
Black Out
Students collect and analyze data. In this statistics instructional activity, students plot their data on a coordinate plane and find the line of best fit. They calculate the linear regression using the data.
Curated OER
Linear Functions
In this linear functions worksheet, students problem solve and calculate the answers to five linear equations associated with volume, point-slope forms, initial value forms and slope-intercept forms.
Curated OER
Worksheet 23
In this math activity, students find two power series solutions to Airy's equation. Then they find the radius of convergence for the solutions.
Curated OER
Worksheet 28 - Spring 1996
For this math worksheet, students examine the graph in polar coordinates of r = f(θ). Then they sketch a graph of the modified functions indicated.
Curated OER
Explanatory and Response Variables
In this explanatory and response variables instructional activity, students answer 4 problems surrounding variable relationships and outliers. Student must construct a scatter plot.
Curated OER
Placing Negative Numbers on a Number Line
Students plot numbers on a number line. In this negative numbers lesson, students create their own number line. Students discuss the concept of negative numbers and plot some on their number lines. Students create true and false...
Curated OER
The Definition Derivative
In this derivative worksheet, students evaluate limits, factor equations, and calculate the given function. They determine the derivative of a function and plot it on a graph. This four-page worksheet contains eight problems.
Curated OER
Transformations
Sixth graders discover transformations. In this graphing lesson, 6th graders explore visual examples of plotting transformations as they review translations, rotations, and reflections. Students also practice solving problems that their...
Curated OER
Float the Boat
Students collect data and analyze it using a graph. In this algebra lesson, students identify different bodies of water and relate the flowing to math. They collect data on the rate of flow and the height of flow. They analyze the data...
Curated OER
Can You Help Me Find My Way Home? (Coordinate Plane)
Fifth graders locate points on a coordinate plane. Through lecture and observation, they discover the parts of the coordinate plane and how to plot an ordered pair. Students locate x and y values in an ordered pair.
EngageNY
Graphs of Simple Nonlinear Functions
Time to move on to nonlinear functions. Scholars create input/output tables and use these to graph simple nonlinear functions. They calculate rates of change to distinguish between linear and nonlinear functions.
EngageNY
Multi-Step Problems in the Real World
Connect graphs, equations, and tables for real-world problems. Young mathematicians analyze relationships to identify independent and dependent variables. These identifications help create tables and graphs for each situation.
Charleston School District
Solving Systems Graphically
When guess and check gets old, it's time to start graphing! An instructive lesson explains how to solve a system of linear equations using graphing. Equations are in both slope-intercepts and standard form.
K5 Learning
Androclus and the Lion
Kindness is never a standalone act. Fourth graders read the classic tale of Androclus and his act of service to the lion, which is repaid to him by the lion in a Roman colosseum. After reading the passage, they answer four comprehension...
Curated OER
Graphing Review
Students review the principles of graphing linear functions. They discuss plotting points on a coordinate plane, solving using a table, and then graphing. Students solve problems and determine the slope of the line, y-intercept and if...
Curated OER
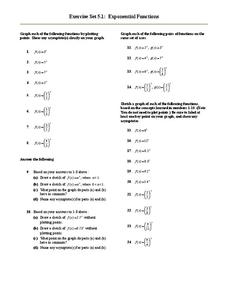
Exponential Functions
With this two-page resource, learners evaluate and graph exponential functions. There are 48 questions using logs and exponents as the parent function.
Raytheon
Graphing: Slope
For this slope worksheet, students complete problems having to do with slope including adding integers, graphing, finding ordered pairs, and more. Students complete 55 problems.
Curated OER
Straight Line Graphs
Young scholars review the techniques of plotting and reading points on a grid. They identify why facts explaining how to read coordinates as well as the importance of the order in which the coordinates are given. Individual practice of...
Curated OER
Coordinates
Students identify and label the coordinate planes by the four different quadrants. In this geometry lesson, students plot an ordered pair correctly. They identify and differentiate between rational and irrational numbers.
Curated OER
Graphing Linear Equations Using the Table Method
Students graph linear equations using a table. In this algebra lesson, students create a table of values using the linear equation to find the y-values. They plot their point on a coordinate plane and graph the line.


