Curated OER
Match Me!
Young learners explore motion graphs in this lesson. They investigate distance-time plots as they move in a specific way in front of the CBR in an attempt to make a motion plot that matches a given plot. Pupils explore the connections...
Curated OER
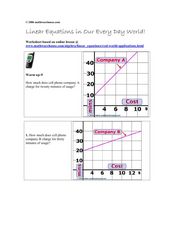
Linear Equations in Our Every Day World!
In this linear equations worksheet, students read and interpret graphed linear equations. They read a story problem, write a linear equation, and plot the points on a coordinate plane. This five-page worksheet cotnains 12...
Curated OER
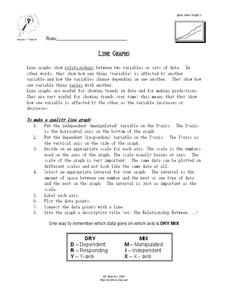
Line Graphs
In this algebra worksheet, learners describe the relationship between a line graph and its data. They define the reasons line graphs are used and discuss increasing and decreasing lines. There is one involved questions, requiring several...
Curated OER
Coordinates
In this geometry worksheet, 10th graders are given points on a coordinate plane, and they must figure out what the x and y values are. There are 6 graphing question.
Curated OER
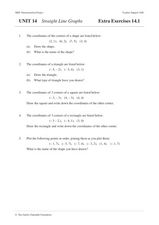
Straight Line Graphs
In this algebra learning exercise, students graph coordinate pairs on a coordinate plane. They match points with letters and graph a line through all the plotting to create a straight line. There are 25 questions with an answer key.
Curated OER
Lines of Fit
Students graph an equation and analyze the data. In this algebra instructional activity, students graph scatter plots and identify the line of best fit using positive correlation, negative correlation an d no correlation. They apply...
Curated OER
Coordinates (2)
In this mathematical activity, students practice plotting the points on a grid using eight different sets of coordinates with a ruler to make eight separate shapes.
Curated OER
Easy Worksheet: Area and Perimeter of Rectangles and Squares
In this area and perimeter of rectangles and squares worksheet, students solve 6 graphing and short answer problems. Students plot four coordinates of a rectangle or square on the coordinate plane. Students find the area or perimeter of...
Curated OER
Earth's Rotation Changes and the Length of the Day
In this Earth's rotation and day length worksheet, students are given a table with the period of geological time, the age of the Earth and the total days per year. Students calculate the number of hours per day in each geological era,...
Curated OER
Solar Flare Reconstruction
In this solar flare reconstruction worksheet, students read about the 'saturation' point of satellite detectors when solar flares are at their most intense phase of brightness. Students are given x-ray flare data and they re-plot the...
Curated OER
Graphs
Students explore graphs and define the different ways they are used to display data. In this algebra activity, students collect data and plot their data using the correct graph. They draw conclusions from their graphs based on their data.
Curated OER
Line 'Em Up!
Students find coordinate points on a grid and create a line graph with those points. This lesson should ideally be used during a unit on various types of graphs. They make and use coordinate systems to specify locations and to describe...
Curated OER
Osprey Journey
Students investigate the migration route of one bird, Osprey B4, using information gathered from satellites to track birds over a two-year period. They coimpare their graphs with maps of B4's migrations that have been plotted by...
Curated OER
New York State Testing Programs Mathematics Test
In this math activity, students review algebraic and geometric concepts as they review for the final exam of 6th grade. There are 35 questions.
Curated OER
Strike a Pose: Modeling in the Real World (There's Nothing to It!)
Adjust this lesson to fit either beginning or more advanced learners. Build a scatter plot, determine appropriate model (linear, quadratic, exponential), and then extend to evaluate the model with residuals. This problem uses real-world...
Curated OER
Lines of Fit
Young scholars solve equations dealing with best fit lines. For this algebra lesson, students solve problems by analyzing data from a scatterplot, and define it as positive, negative or no correlation. They classify slopes the same way...
Curated OER
Inequalities and Measures of Central Tendency
In this inequality and measures of central tendency worksheet, students solve and graph linear inequalities. They organize given data to identify the mean, mode and range. Students interpret box-and-whisker plots. This three-page...
Curated OER
Modeling a Planetary Nebula
In this modeling a planetary nebula activity, students use a diagram to calculate the intensity at different radii from the center of the nebula. Students use the Pythagorean Theorem to determine the distance between two points on the...
Curated OER
A Second View of Polar Coordinates
In this polar coordinates worksheets, students change ordered pairs from rectangular form to polar form. They plot and label points and identify alternative coordinate pairs for given points. There are approximately 20 problems on this...
Curated OER
Investigating Linear Equations Using Graphing Calculator
Students investigate linear equations using the Ti-Calculator. For this algebra lesson, students graph lines and identify the different quadrants on a coordinate plane. They identify ordered pairs used to plot lines.
Curated OER
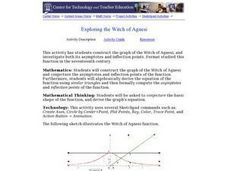
Exploring the Witch of Agnesi
students construct the graph of the Witch of Agnesi, and investigate both its asymptotes and inflection points. They construct the graph of the Witch of Agnesi and conjecture the asymptotes and inflection points of the function. ...
Curated OER
Statistics Newscast in Math Class
Young scholars study sports teams, gather data about the teams, and create a newscast about their data. For this sports analysis lesson, students research two teams and define their statistical data. Young scholars compare the two teams,...
Curated OER
MA 439-Math of Image Processing
In this image processing instructional activity, students use a matrix to solve ten problems. For the first six problems, students are guided to the answer by carefully sequenced questions. The final four problems require students to...
Curated OER
A Sum of Functions
Collaborative learners will see the geometric addition of functions by graphing the sum of two graphed curves on the same coordinate plane. This task then naturally flows into giving learners the algebraic representation of the curves...


