Curated OER
Stem-and- Leaf Plots
Students are introduce to the notion of stem-and-leaf plots. They use stem-and-leaf plots to calculate the mean, median, and mode of a set of data. Students use computers to learn about stem-and-leaf plots.
Curated OER
Box Plots
Students review the concept of median, explore how to calculate quartiles for any size data set and experience how to build a box plot.
Curated OER
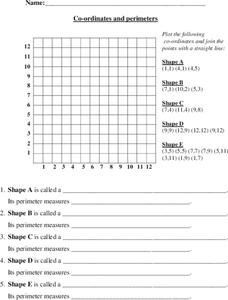
Coordinates and Perimeters
Here is a lesson containing a great activity based on coordinates, and the perimeters of shapes created using a given set of coordinates. After youngsters creat a shape on a grid based on some coordinate pairs, they must identify which...
Curated OER
Points in the X-Y Plane
Students plot points on the x-y plane using x and y coordinates. They describe how the x and y values relate to the position of the point on the plane. Finally, students plot points that fit a linear relationship and summarize that a...
Curated OER
Points In the X-Y Plane
Students plot points on the x-y plane using x and y coordinates and describe how the x and y values relate to the position of the point on the plane. They plot points that fit a linear relationship. They explain that their horizontal and...
Curated OER
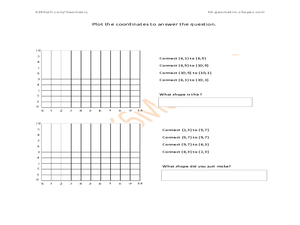
Plot the Coordinates
In this plotting coordinates worksheet, students plots sets of coordinates on graphs, then identify the shape the connected points have created. A reference web site is given for additional activities.
Curated OER
Geometry Coordinates
In this geometry coordinates worksheet, students plot given ordered pairs. This one-page worksheet contains 6 problems.
Curated OER
Who's got the fastest legs?
Students use a stopwatch to collect information for a scatterplot. In this fastest legs lessons, students collect data through the taking of measurements, create and find a median number. Students develop an equation and...
Texas Instruments
Making Predictions Using Systems of Equations
Young scholars explore the concept of systems of equations. In this system of equations lesson, students enter data into lists on their calculators about 100 meter dash times. Young scholars plot the points using a scatter plot and...
Curated OER
Points in the Complex Plane -- Lab
Students review the lecture portion of this lesson. Individually, they graph various points on a complex plane and identify conjugates based on their location on the graphs. They complete a worksheet and review their answers to end the...
Curated OER
Snowfall Statistics for Snowboarding
Students use the Internet to collect the current daily snowfall amounts and also to find the price of a lift ticket for snowboarding at different ski resorts in the United States.
Inside Mathematics
Suzi's Company
The mean might not always be the best representation of the average. The assessment task has individuals determine the measures of center for the salaries of a company. They determine which of the three would be the best representation...
EngageNY
Distance on the Coordinate Plane
Scholars learn how to find the distance of vertical and horizontal line segments on the coordinate plane in the 19th installment of a 21-part module. The use of absolute value comes in handy.
CK-12 Foundation
Least-Squares Regression
Residual plots let you find the perfect line of best fit. As users adjust the points on a scatter plot and a possible line of best fit, the interactive automatically changes the residual plot. This change allows them to see connections...
GeoGebra
All For One, One For All
Will someone please constrain those pets? Pupils create two constraint equations on the number of cats and dogs for a pet sitter. They choose specific points and determine whether the point satisfies one or both constraints. The...
EngageNY
The Mean Absolute Deviation (MAD)
Is there a way to measure variability? The ninth resource in a series of 22 introduces mean absolute deviation, a measure of variability. Pupils learn how to determine the measure based upon its name, then they use the mean...
Bantam Books
The Tempest: Chalk Talk
Discussion doesn't always need to be spoken. Before you begin The Tempest by William Shakespeare, have kids connect their ideas and experiences to central questions of the play with a silent discussion activity. Once they have...
CK-12 Foundation
Graphs in the Coordinate Plane: Functions on a Cartesian Plane
Connect the dots to graph a linear function. Young mathematicians use an interactive to first plot provided points on a coordinate plane. They connect these points with a line and then answer questions about the slope and y-intercept of...
CK-12 Foundation
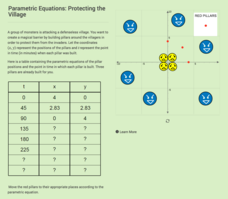
Parametric Equations: Protecting the Village
Determine the location of the pillars in time. Given a table of values for two parametric equations, pupils complete the table to determine the location and time it takes to build the pillars. Learners plot the points representing...
Radford University
How to Calculate and Analyze the Equation for a Parabolic Path
Working in groups, pupils plot three points on the coordinate plane representing three different parabolic paths. Using a calculator, they determine the quadratic regression equation for their models. Each team then figures out the...
Curated OER
Rational Functions
Through a mini assessment, high schoolers identify and list the vertical and horizontal asymptotes for the given rational functions and determine the type of asymptote of a given rational function. They also decide which form of a...
Curated OER
Graph a Picture on Cartesian Coordinates
Find out what picture is hidden in this graph and work on coordinate graphing with this worksheet! Learners plot 66 ordered pair points on a Cartesian graph, then connect the dots to make a picture. This would work as an in-class...
Common Core Sheets
Determining Coordinates: Graphing Patterns
Building on their prior knowledge about patterns, this series of worksheets introduces young mathematicians to graphing in the coordinate plane. Using written descriptions of different numerical patterns, learners...


