Willow Tree
Midpoint and Distance Formulas
The shortest distance between two points is a straight line. Learners use the Pythagorean Theorem to develop a formula to find that distance. They then find the midpoint using an average formula.
Curated OER
Graph Mole
Practice graphing ordered pairs by playing an online graphing game. Learners will discover why it is useful to plot coordinates on a xy plane. Graph Mole, is the online game that allows them to practice through a fun, interactive story....
Curated OER
Line of Best Fit
In this line of best fit learning exercise, students solve and complete 8 different problems that include plotting and creating their own lines of best fit on a graph. First, they study the samples at the top and plot the ordered pairs...
EngageNY
Describing Distributions Using the Mean and MAD II
The 11th lesson in the series of 22 is similar to the preceding lesson, but requires scholars to compare distributions using the mean and mean absolute deviation. Pupils use the information to make a determination on which data set is...
Alabama Learning Exchange
How Old is Your Money?
Elementary learners explore coin mint dates. First, they listen to the book Alexander Who Used to be Rich Last Sunday by Judith Viorst. They then sort a collection of coins according to their mint date and put them in order from oldest...
EngageNY
Mid-Module Assessment Task: Grade 8 Module 6
Make sure pupils have the skills to move on to the second half of the module with a mid-module assessment task. The formative assessment instrument checks student learning before moving on to the rest of the lessons in the unit.
Curated OER
Separate Vacations
High schoolers plot the migration paths of birds using latitude and longitude data from a table.
Statistics Education Web
Sampling in Archaeology
Compare different random sampling types using an archaeological setting. Scholars collect data from an archaeological plot using simple random samples, stratified random samples, systematic random samples, and cluster random samples....
Curated OER
How Does Water Cool?
How fast does water cool? First fifth graders will draw a line on a graph that predicts how fast they think water can cool from boiling. Then they plot the actual data on the same graph to see if their estimate was correct.
Curated OER
Position and Time Graphs
A series of graphs are displayed with points plotted for time and position. A question is asked for each, requiring your class to view one axis and track its partner coordinate. A few examples are given to begin each section, and so this...
Mathwire
Graph Each Ordered Pair - Five Worksheets
This resource is composed of five separate worksheets on ordered pairs. After plotting each ordered pair, learners label each point, connect the points to create a figure, identify the polygon type, find the perimeter and area of the...
Curated OER
Jon and Charlie's Run
Let's use math to solve an argument. Jon and Charlie are debating about who can run farther, but who is right? That's what your class will figure out as they apply their understanding of fractions to this real-life situation. A simple,...
Math Sphere
Co-Ordinates
Challenge young mathematicians' understanding of the coordinate plane with this series of skills practice worksheets. Offering 10 different exercises that involve identifying ordered pairs,...
Curated OER
Come Fly with Me . . . Open a Book: Travels through Literature
This detailed overview of a curriculum unit suggests using travel literature to engage and stimulate your third graders’ interest in reading. The suggested reading list includes fiction and non-fiction materials and offers urban children...
Curated OER
Coordinate Grid: Area and Circumference of Circles
Here is a geometry worksheet in which learners plot the points of a circle onto a coordinate grid and proceed to calculate the area or circumference of the circle. There are four questions.
Concord Consortium
Function Project
What if a coordinate plane becomes a slope-intercept plane? What does the graph of a linear function look like? Learners explore these questions by graphing the y-intercept of a linear equation as a function of its slope. The result is a...
Curated OER
Graphs and Equations
In this graphs and equations worksheet, students solve and complete 5 various types of problems. First, they complete a table of values for a given quadratic function. Then, students use the graph to find an estimate for the solutions of...
Curated OER
Solving Systems Using Substitution
Write a math story for a series of problems using given variables. The class writes stories, showing understanding of strategies in compound sentences. They then solve the equations.
Curated OER
Pick A Number
Elementary schoolers find out which month has the most class birthdays (mode) and which birthday represents the middle point of all the birthdays (median). They gather and organize data to find one number that fairly represents the whole...
Illustrative Mathematics
Half of a Recipe
Kids love to cook! What is a better place to learn mixed numbers than with a recipe? It is up to learners to decide how they want to divide this recipe in half. They may choose to model the mixed number and then divide the model by two....
Mathematics Assessment Project
Sugar Prices
Sugar rush! For this assessment task, learners interpret points on a scatter plot representing price versus weight for bags of sugar. They then determine the bag that represents the best value.
Curated OER
Explorations 5: Introduction to Limits
In this limit worksheet, students find the interval values of given functions. They identify constants, and plot graphs. This three-page worksheet contains approximately 20 problems.
Concord Consortium
Twinkle, Twinkle
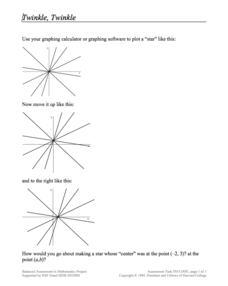
Take a look at a star resource. Young mathematicians use a graphing calculator to draw intersecting lines that look like a star. They then apply translations to move the entire star and also consider what transformations must occur to...
Curated OER
Just Me and My Shadow
Middle schoolers take measurements throughout the day using a simple sundial called a gnomon. They record the results on a Data Log and convert from English units to metric (S.I.) units. Data points are plotted on the same graph and...


