Curated OER
Reading and Making Pie Graphs
In this pie graphs activity, students solve 10 different problems that include reading a pie graph. First, they use the pie graph to respond to 5 questions that follow. Students determine the year that had the smallest and largest number...
Curated OER
Table Readings
In this table worksheet, students read questions and interpret tables. Questions include information concerning unemployment, oil imports, and foreign students. This multiple-choice worksheet contains 10 problems. ...
Curated OER
Frequency Histograms, Bar Graphs and Tables #3
In this frequency histograms instructional activity, students examine bar graphs, histograms and tables. They identify the model of information that best matches the statistics. This three-page instructional activity cotnains...
Curated OER
Making a Bar Graph
In this bar graph worksheet, students analyze a data table and bar graph depicting information about stickers collected. Students answer 5 questions about the data displayed.
Curated OER
Sunshine Math
In this word problems activity, students solve 7 problems that pertain to addition, subtraction, geometry, making a table and telling time.
Curated OER
Toothpick Patterns
In this patterning worksheet, students identify and complete 15 different patterns that include using toothpicks. First, they determine the number of toothpicks needed to create each figure in a given sequence. Then, students determine...
Curated OER
Probability Games and Activities, Unit 10
Looking for tangible ways to practice probability with your class? Through 4 activities, students practice with experimental probability, using math to make educated guesses, then testing it through physically completing the experiment....
Yummy Math
Diapers
Most of your students probably think a car or college is the first big expense their parents could help them with, but as it turns out these kids have been costing their parents for their whole lives. Have they ever considered how much...
Curated OER
Dance Challenge: Calculate and Compare Speed by Measuring a Series of Dance Movements
Really neat! Kids choreograph a dance phrase and then measure the distance and speed of the phrase using a timer and a meter stick. They collect the data on a table which they use to determine an average. A series of observation and...
Curated OER
Instantaneous Rate of Change of a Function
Pupils draw the graph of a door opening and closing over time. They graph a given function on their calculators, create a table of values and interpret the results by telling if the door is opening or closing and evaluate the average...
Curated OER
Working With Basic Units of Time
In this math worksheet, students investigate telling time, elapsed time and word problems pertaining to time. Students also convert minutes to hours and hours to days. There are 40 problems on the 3 pages.
Curated OER
Magic Squares, Simultaneous Equations, Hill Walking, and Diophantine Equations
In this solving equations worksheet, 9th graders solve and complete 21 various types of problems. First, they use the method shown to find the value of xin each equation. Then, students use an algebraic approach to solve the magic...
EngageNY
Multi-Step Problems in the Real World
Connect graphs, equations, and tables for real-world problems. Young mathematicians analyze relationships to identify independent and dependent variables. These identifications help create tables and graphs for each situation.
EngageNY
Comparison Shopping—Unit Price and Related Measurement Conversions
Speed up your scholars' understanding of ratios. Class members compare ratios related with speeds presented in different representations. They then use the unit rates to make the comparisons.
Inside Mathematics
Hexagons
Scholars find a pattern from a geometric sequence and write the formula for extending it. The worksheet includes a table to complete plus four analysis questions. It concludes with instructional implications for the teacher.
EngageNY
Substituting to Evaluate Addition and Subtraction Expressions
Substitute this resource for what you used to use. Learners identify patterns in data tables and write addition and subtraction expressions to represent relationships. Substitution allows them to solve problems in context in the 20th...
Inside Mathematics
Swimming Pool
Swimming is more fun with quantities. The short assessment task encompasses finding the volume of a trapezoidal prism using an understanding of quantities. Individuals make a connection to the rate of which the pool is filled with a...
Howard County Schools
To Babysit or Not to Babysit?
Would you work for a penny today? Use this activity to highlight the pattern of increase in an exponential function. Scholars compare two options of being paid: one linear and one exponential. Depending on the number of days worked, they...
Virginia Department of Education
Graphing Linear Equations
Combine linear equations and a little creativity to produce a work of art. Math scholars create a design as they graph a list of linear equations. Their project results in a stained glass window pattern that they color.
Houghton Mifflin Harcourt
Convert Customary Units of Length
Sports fans will really enjoy this unit conversion assignment. A table of standard measurements for football-related equipment is presented as the data for solving six word problems. For all of the problems, players will need to convert...
Yummy Math
US Holiday Candy Sales
Candy is a big business! Calculate the amount of money consumers spent on major holidays—Easter, Halloween, Christmas, Hanukkah, and Valentine's Day—based on the total amount of candy sales from 2011 and the percentage of each holiday's...
EngageNY
A Synthesis of Representations of Equivalent Ratio Collections
Make all the ratio representations fit together. The 15th segment in a series of 29 presents ratio problems to solve. Scholars use a variety of representations to respond to the questions. The problem set has pupils show how the...
Curated OER
Worksheet 5: Property Limits and the Squeeze Theorem
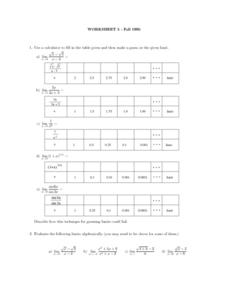
For this math worksheet, young scholars answer 6 questions regarding given limits in a table of data, properties of limits and the Squeeze Theorem.
Virginia Department of Education
Graphs
Examine different types of graphs as a means for analyzing data. Math scholars identify the type of graph from a series of data displays and then develop questions to match each one. Then, given a scatter plot of height versus age...


