Curated OER
Percentages and Fractions of Amounts
In this math worksheet, students change percents to fractions on five problems. Students complete a table. Students find a given percent of five numbers. They complete five story problems involving percents.
Curated OER
Finding Probabilities Using Lists of Outcomes
In this probability worksheet, students solve 5 multi-step questions pertaining to making lists of possible outcomes and calculating probability. This page is intended to be an online activity, but can be completed on paper.
Curated OER
Data Analysis
In this data analysis worksheet, students solve and complete 4 different types of problems. First, they reduce the data provided to find the means, and graph the means in a line graph. Then, students graph the data from each mixture...
Curated OER
Ingetrated Algebra Practice
In this integrated algebra worksheet, students solve probability problems. They identify the appropriate sample space for the given experiment. This two-page worksheet contains 4 multiple-choice problems. Answers are...
Curated OER
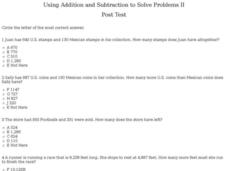
Using Addition and Subtraction to Solve Problems II: Post Test
In this addition and subtraction worksheet, students answer a set of 10 multiple choice questions, clicking on a link to print page or view correct answers.
Curated OER
Magic Square Trig Identities
In this trig instructional activity, 12th graders review their trig identities using a table. They answer questions 1-16 as given clues to find the answer to the correct identity.
Curated OER
Integrated Algebra Practice: Exponential Growth
In this exponential growth worksheet, students solve 4 short answer and multiple choice problems. Students determine the population of a city after a given amount of time.
Curated OER
Math Skills: Conversions
In this conversions worksheet, students use metric unit conversions to solve fifteen word problems that involve converting from one unit to another.
Curated OER
Family Activity - Color by Numbers: Fractions, Decimals, and Percents
Learners solve four short answer problems. They determine the number of each color of candy or paper clip in a bag, and calculate the fractional, decimal, and percentage representation of the color compared to the total number of items.
Curated OER
Collect and Organize Data - Practice 14.1
In this data collection worksheet, students read the word problem and study the tally chart about favorite sports. Students then use the information in the chart to answer the questions. Students then use the list about students'...
Curated OER
Geometry Coordinates
In this geometry worksheet, 10th graders calculate ordered pairs using a table to plot the coordinate pairs to make a graph. There are 3 graphing question.
Curated OER
Building Big Ideas in Math With a Frog Theme
In this problem solving worksheet about frogs, students complete two pages of activities. Students figure out how a frog can hop between lily pads following the rules given. Students draw all possible paths.
Inside Mathematics
Coffee
There are many ways to correlate coffee to life, but in this case a worksheet looks at the price of two different sizes of coffee. It requires interpreting a graph with two unknown variables, in this case the price, and solving for...
Curated OER
What's Your Favorite Fruit?
A sweet activity to challenge your first graders! The picture graph displays a class's favorite fruits. Young learners solve various problems with the data, including counting the amounts of each kind of fruit, and interpreting which...
Illustrative Mathematics
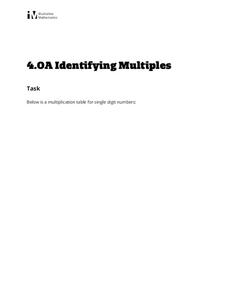
Identifying Multiples
Administer an activity that fosters a child's understanding of multiples. Young mathematicians are guided to complete three tasks on a multiplication chart. Once they color the boxes with multiples of two, three, and four, learners...
EduGAINs
Data Management
Using a carousel activity, class members gain an understanding of the idea of inferences by using pictures then connecting them to mathematics. Groups discuss their individual problems prior to sharing them with the entire class....
Illustrative Mathematics
Find the Change
This exercise is an opportunity for algebra learners to understand the connection between the slope of a line and points found on the line. Use similar triangles to explain why slope m is the same between any two points. Discuss with the...
Illustrative Mathematics
The Price of Bread
As part of an initiative to strengthen our young adults' financial understanding, this problem explores the cost of bread and minimum wage since the 1930s. Learners are asked to find the percent increase from each year and compare it...
Concord Consortium
Last Digit Arithmetic
Mathematics involves a study of patterns. The exploratory lesson has learners consider the addition pattern in different sets of numbers. Each set has a different pattern that pupils describe mathematically. The patterns involve...
Willow Tree
Circle Graphs
Pie isn't just for eating! Scholars learn to create pie charts and circle graphs to represent data. Given raw data, learners determine the percent of the whole for each category and then figure out the degree of the circle that percent...
Curated OER
Sorting 2-Dimensional Shapes
Some shapes have square corners, and some do not. Scholars participate in a sorting activity as they determine if these 12 shapes have square corners, categorizing them based on this attribute. Encourage geometers to draw the square into...
Curated OER
Foxes and Rabbits 3
Use realistic data to find trigonometric models that best fit the populations of foxes and rabbits in a national park. Included are detailed explanations of the answers and process. This is a follow-up exercise to the lesson listed in...
Bowland
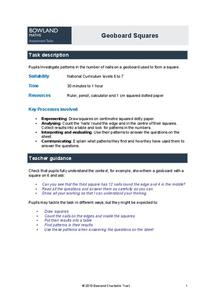
Geoboard Squares
Don't be a square! Help your budding mathematicians discover patterns within squares. Scholars create squares on geoboards and identify patterns in the number of nails, both nails on the edge of the squares and nails within the squares....
Bowland
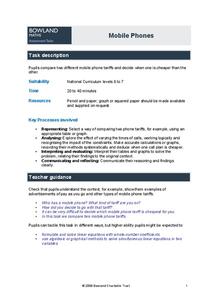
Mobile Phones
Cheaper cell phone bills? Learners compare two different cell phone plans for a specified number of minutes of phone usage each day. They also determine the conditions for which one plan is cheaper than the other.


