Math Drills
Valentine's Day Ordering and Comparing (B)
Discover this Valentine's Day-themed worksheet where young mathematicians answer word problems using data tables.
Curated OER
Factors of Numbers from 31 to 65
Finding factors is an integral aspect of multiplication. Although there are two examples here, they don't illustrate the process so you will still need to model this a few times for scholars. First, mathematicians list the factors for...
Curated OER
Froot Loops to the Max - Predictions and Weighing
In this prediction and weighing worksheet, middle schoolers complete and solve 5 problems related to a box of Froot Loops cereal. First, they complete the table with the data each team finds with their box of cereal. Students determine...
Curated OER
Frequency Tables - Home Link Support
In this home school support worksheet, 2nd graders, with a home support person, review the use of frequency tables to organize and display data. They make their own frequency table and read it with the support person.
Curated OER
Make a Frequency Table and a Histogram for a Given Set of Data
In this data recording and data organization worksheet, students create one frequency table and one histogram for a given list of data. Explanations and examples for frequency tables and histograms are given.
Curated OER
Use or Make a Table
In this use or make a table worksheet, students examine data given in a story problem. They use logic to determine the best way to begin organizing the data and creating a table. This one-page worksheet contains three...
Houghton Mifflin Harcourt
Graphs from Patterns
Fifth graders analyze patterns and begin looking at function tables. This is a pertinent preparation for graphing patterns. In fact, consider giving your class a piece of graph paper and then teach them how!
Beyond Benign
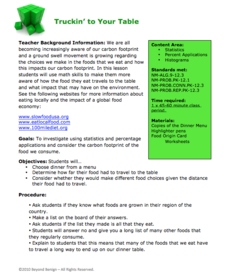
Truckin’ to Your Table
Food takes a trip to the table. Class members choose a meal from a menu and calculate the total cost of the meal including tax and tip. Using a food origin card, pupils determine how far each of the ingredients of a meal traveled to end...
EngageNY
Linear Equations in Two Variables
Create tables of solutions of linear equations. A lesson has pupils determine solutions for two-variable equations using tables. The class members graph the points on a coordinate graph.
Curated OER
Making a Ten
An addition table supports third graders as they learn strategies to improve their math fluency. When finding sums greater than ten, students are taught how to first make a ten and then add on the rest. A similar method is also...
Curated OER
Conversion Tables
Here are some practical conversion scenarios for scholars to figure out. They examine an example table converting cents to dollars before completing two of their own. For the first, learners convert weeks to days. Some of these are done...
EngageNY
Chance Experiments with Outcomes That Are Not Equally Likely
The fifth portion of the 25-part series introduces probabilities calculated from outcomes that are not equally likely. Class members use tables to calculate probabilities of events, add outcome's probabilities, and find...
EngageNY
Sampling Variability
Work it out — find the average time clients spend at a gym. Pupils use a table of random digits to collect a sample of times fitness buffs are working out. The scholars use their random sample to calculate an estimate of the mean of the...
DK Publishing
Money for Chores - Mixed Tables
Do your young mathematicians get paid for chores at home? Use this familiar real-world concept to explore multiplication and money math. They use a chart of chore payments to answer six questions and determine how much money Joe and...
Illustrative Mathematics
Making a Ten (Grade 1)
How many ways can first graders make a 10? Using an addition chart, learners color in the 10s on the table. They notice and explain the meaning of the pattern, and how to get to another sum of 10.
Howard County Schools
Setting the Table
How many people can fit around a table? Depends on the size of the table, right? Explore patterns to generate an equation for the number of people that can fit around a table given its size.
Concord Consortium
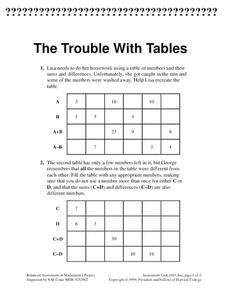
The Trouble with Tables
Tackle these tables. A performance task has learners complete two puzzles using addition and subtraction. They must fill in tables with missing addends, sums, minuends, subtrahends, or differences.
EngageNY
Conducting a Simulation to Estimate the Probability of an Event II
Add some randomization into simulations. The 11th installment in a series of 25 presents two new methods to use in simulations--colored disks, and random numbers. Pupils use random numbers to run simulations where the probabilities make...
Noyce Foundation
Granny’s Balloon Trip
Take flight with a fun activity focused on graphing data on a coordinate plane. As learners study the data for Granny's hot-air balloon trip, including the time of day and the distance of the balloon from the ground, they practice...
DK Publishing
4 Times Table
It's all about the fours as scholars practice their multiplication facts. They skip count on a number chart, shading in each multiple of four. Do they notice a pattern? Next, scholars complete five number sentenes multiplying four by...
EngageNY
Writing Addition and Subtraction Expressions
Symbols make everything so much more concise. Young mathematicians learn to write addition and subtraction expressions — including those involving variables — from verbal phrases. Bar models help them understand the concept.
Charleston School District
Pre-Test Unit 9: Scatter Plots
What do your classes know about statistics? Use a pre-test to determine their background. Topics include scatter plots and lines of best fit, two-way frequency tables, and modeling with linear equations.
Illustrative Mathematics
Mr. Brigg's Class Likes Math
A quick discussion question that brings some collaboration into your classroom will allow your thinkers to make a decision about sampling. Mr. Briggs wants to know if the results from his class are a valuable comparison to the entire...
Curated OER
Problem Solving: Make a Table
In this problem solving worksheet, 2nd graders solve and complete 4 different problems that include counting different amounts of coins. First, they determine the number of nickels and dimes in each. Then, students determine the total...


