EngageNY
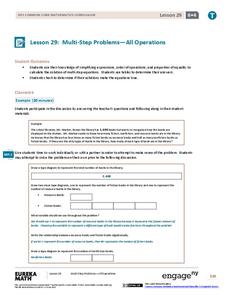
Multi-Step Problems—All Operations
Harness the power of algebra to solve problems. Young mathematicians learn to work out multi-step problems by applying algebraic techniques, such as solving equations and proportions. They use tape diagrams to model the problem to finish...
Inside Mathematics
Rugs
The class braids irrational numbers, Pythagoras, and perimeter together. The mini-assessment requires scholars to use irrational numbers and the Pythagorean Theorem to find perimeters of rugs. The rugs are rectangular, triangular,...
Virginia Department of Education
Exponential Modeling
Investigate exponential growth and decay. A set of six activities has pupils collecting and researching data in a variety of situations involving exponential relationships. They model these situations with exponential functions and solve...
Inside Mathematics
Squares and Circles
It's all about lines when going around. Pupils graph the relationship between the length of a side of a square and its perimeter. Class members explain the origin in context of the side length and perimeter. They compare the graph to the...
EngageNY
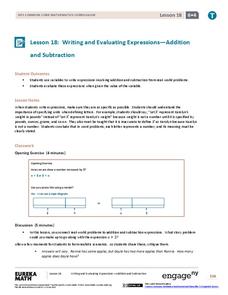
Writing and Evaluating Expressions—Addition and Subtraction
Let Y represent Yes to using an excellent resource. Pupils first learn to define variables using a complete description in the 19th part in a series of 36. They write expressions involving addition and subtraction in real-world...
Virginia Department of Education
How Much is that Tune?
Tune in for savings! Scholars investigate pricing schemes for two different online music download sites. After comparing the two, they determine the numbers of songs for which each site would be cheaper.
EngageNY
Replacing Letters with Numbers
When did letters become the same as numbers? Scholars learn about substituting numbers for letters to evaluate algebraic expressions in the seventh part in a series of 36. The lesson focuses on expressions related to geometry, such as...
EngageNY
Linear and Nonlinear Expressions in x
Linear or not linear — that is the question. The lesson plan has class members translate descriptions into algebraic expressions. They take the written expressions and determine whether they are linear or nonlinear based upon the...
EngageNY
The Difference Between Theoretical Probabilities and Estimated Probabilities
Flip a coin to determine whether the probability of heads is one-half. Pupils use simulated data to find the experimental probability of flipping a coin. Participants compare the long run relative frequency with the known theoretical...
Virginia Department of Education
Road Trip
Help plan a road trip with linear equations. Scholars consider two different rental car companies and write equations representing the cost for each company. They graph the system of equations to determine the conditions under which each...
Virginia Department of Education
Equations of Lines
Scholars connect slope-intercept form and standard form to the values of m and b by first matching a set of cards that have slope-intercept form, standard form, values of m, values of b, and graphs of linear equations. They then...
Curated OER
Math - "Where Am I?" Position in Space
A big part of understanding mathematical concepts is by mastering the vocabulary associated with those concepts. Students identify and explore positional/directional words as they relate to math. Students answer eleven fill-in-the-blank...
Curated OER
Zipping Around the Zoo
In this reading a schedule worksheet, 2nd graders are given a table with the times that activities will happen at the zoo. They decide what they would like to do at the zoo and create a schedule of activities for themselves.
Curated OER
Access Ramp
Just about every public building that your students are familiar with has an access ramp which complies with ADA requirements. As it turns out, designing such a ramp is an excellent activity to incorporate slope, the Pythagorean Theorem,...
Super Teacher Worksheets
Counting Memory Match Game
What a fun way to practice counting! Print these cards for an easy go-to matching game. Partners take turns playing a memory game, flipping the cards over to try to match a number with the card that has the corresponding number of...
Curated OER
Math Club #19: Brain Twisters
In this brain twisters worksheet, 7th graders work in groups to solve 7 puzzles using logic and problems solving skills.
Curated OER
Math Maven's Mysteries: The Cafeteria Caper
In these math word problem worksheets, students help solve the mystery about the cafeteria caper. Students determine what each students' favorite food is by making a chart to organize information from the story. Students then find the...
Curated OER
Spaceship math Multiplication 1-12
In this multiplication worksheet, students solve 40 problems where they find the product where the factors are the numbers 1 through 12. Space is provided at the bottom of the page to record a goal, the number of problems complete and...
Curated OER
Math in Science-Radioactive Decay and Half-Life
In this radioactive decay and half-life instructional activity, students use given half-lifes to calculate the amount of time it will take for certain amounts of elements to decay. They also find the age of samples and determine how many...
Bowland
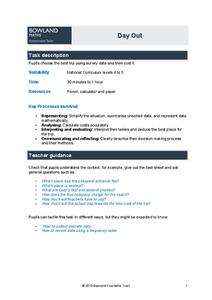
Day Out
Use mathematics to help plan a field trip. Scholars use the results of a survey to determine where a class should go on a field trip. They use provided data about entrance fees and mileage to calculate the cost per person of such a...
Curated OER
Some of the 6s
Quick! Can your mathematicians recall multiples of six in these timed exercises? There are 26 equations here, split into five distinct sections. Learners fill in products and factors, dealing with number sentences in both numeral and...
Shmoop
Box, Stem-Leaf, and Histogram
A helpful and versatile worksheet requires young mathematicians to analyze data in order to create graphs and answer questions. Additionally, it prompts learners to find the mean, median, mode, and range of some of the data sets.
Curated OER
Where Did the Bunny Leave the Eggs? Picture Graphing Activity
The Easter Bunny left us a bunch of eggs, but how many did he leave? Learners use the data to create a picture graph, interpret it, and answer the questions that follow. There's even easy egg cut-outs for your youngsters!
Curated OER
Line of Best Fit
In this line of best fit worksheet, students solve and complete 8 different problems that include plotting and creating their own lines of best fit on a graph. First, they study the samples at the top and plot the ordered pairs given on...


