Curated OER
The Global Warming Debate and the Arctic Ice Cap
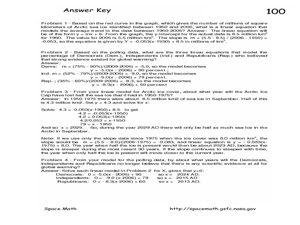
In this global warming and the Arctic ice cap worksheet, students use two graphs showing data about the amount of Arctic sea ice between 1950 and 2006 and the percent of people surveyed that believe the Earth has gotten warmer over the...
Curated OER
Let's Graph It!
Learners graph the height of others in centimeters and inches, find the slope of line in order to calculate the conversion factor between centimeters and inches.
Curated OER
Rational Numbers
Young scholars investigate rational numbers in this algebra lesson. They graph systems of equations and use technology to find the point of intersection. They need a TI for this assignment.
Curated OER
Scatterplots and Regressions
In this scatterplots and regressions activity, students solve 6 different types of problems related to graphing scatterplots and interpreting regressions. First, they create a scatterplot from the given data coordinates and then,...
Curated OER
Can You Carry a Tune in a Bucket?
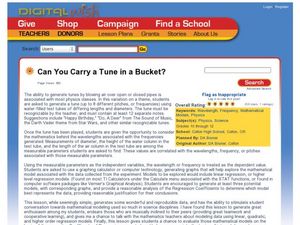
Young scholars use water filled pipes to play a tune and consider the mathematics behind the sound waves. In this sound wave lesson, students play a tune with water filled pipes. They create a mathematical model to evaluate the...
Curated OER
Algebra: Mirror, Mirror on the Universe
Students assess how algebra, telescopes, space exploration and optics are so important in astronomy. They encounter studies on the Hubble Space Telescope, Hubble Deep Field and how algebra helps to determine the effects of contamination...
Curated OER
My Peanut Butter is Better Than Yours!
Students explore the concept of statistical data. In this statistical data lesson, students read an article about the dangers of peanut butter to those who are allergic. Students perform a taste test of two different brands of peanut...
Curated OER
Reading Graphs
Students practice plotting functions on the Cartesian coordinate plane, see several categories of functions, including lines and parabolas, and read a graph, answering questions about the situation described by the graph
Curated OER
Reading Graphs
Students plot functions on the Cartesian coordinate plane. They explore lines and parabolas. Students analyze graphs and answer questions about the information presented on the graph using an online program.
Curated OER
What Are The Chances
Students calculate the probability of an event occurring. In this probability instructional activity, students differentiate between independent, dependent or compound events. They find the range of the data.
Curated OER
Collecting the Rays
Pupils investigate the affect shape has on the ability of a solar panel to collect sunlight. In this collecting sunlight using a solar panel lesson plan, students determine which solar panel shape collects the most sunlight. Pupils use...
Curated OER
The Quadratic Formula
Students solve quadratic function by completing the square. In this algebra lesson plan, students use the quadratic formula to factor quadratics and find the roots. They graph the parabola and identify its properties.
Curated OER
Graphing System of Equations
Students solve system of equation. In this algebra lesson, students graph, substitute and eliminate to solve system of equation. They identify the point of intersection and how many solution each system will have.
Alabama Learning Exchange
The State Capital of Stem and Leaf
Students explore the concept of stem and leaf plots. For this stem and leaf plots lesson, students plot the 50 US states' capitals on a stem and leaf plot according to the first letter of each state. Students compare their stem and...
Curated OER
Polygon Perimeters
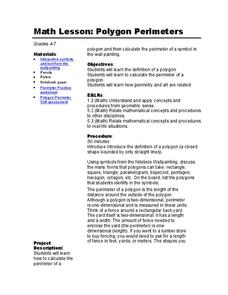
Students complete worksheets where they calculate the perimeter of polygons. In this perimeter of polygons lesson plan, students divide complex shapes into simple shapes to find the perimeter.
Curated OER
Means of Growth
Students collect and graph data. In this statistics lesson, students analyze their plotted data using a scatter plot. They identify lines as having positive, negative or no correlation.
Pennsylvania Department of Education
Analyzing Numeric and Geometric Patterns of Paper Pool
Learners use concrete and pictorial representation of geometric patterns to extend patterns. In this geometric patterns lesson plan, students identify patterns and extend them.
Curated OER
Walking on Air
Students collect and analyze data with a graph. In this statistics instructional activity, students use central tendencies to find the meaning of their data. They display the data on a Ti calculator.
Curated OER
Polygon Perimeters
Students define the terms polygon and perimeter to begin the lesson. Using a calculator, they practice determining the perimeter of various symbols in a painting. They discuss how geometry and art are related to one another.
Curated OER
Perimeter
Students explore the concept of perimeter. In this perimeter lesson, students discuss how to find perimeter of various shapes. Students use the Perimeter Explorer applet to find the perimeter of various shapes.
Curated OER
Geographical Skills-- Map Scale
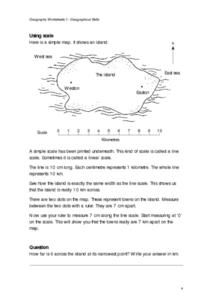
In this maps learning exercise, students study a simple map and the scale in kilometres. Students read the directions and answer one question. Students then look at a sketch map of a town and answer 2 questions. Students also read how to...
Curated OER
The Swinging Pendulum
Students observe a pendulum and graph their observation. In this algebra lesson, students use the TI calcualtor to graph the motion the pendulum makes. They analyze the graph and make predictions.
Curated OER
Pythagorean Theorem
Learners solve problems using the Pythagorean Theorem. For this geometry lesson, students identify the sides and angles of a right triangle. They find the different trigonometric ratios and solve using sine, cosine and tangent.
Curated OER
Graphing and the Coordinate Plane
Students gain practice reading coordinates and plotting points by participating in the Coordinates! Game. They demonstrate and test their skills with graph paper and the Maze Game.


