Curated OER
Graphs - On the Floor and Ask a Friend
Students create a floor graph and then interview their classmates to create their own graph.
Curated OER
"If You Hopped Like a Frog" by David M. Schwartz
Middle schoolers brainstorm several animal/personal scenarios, select one, and write out an explanation of the comparison. They apply the measurements/characteristics to themselves and use algebraic equations to demonstrate the comparison.
Curated OER
Let's Go Camping
Fifth graders plan a budget for a camping trip. They use a spreadsheet to organize the budget and word processing justification for their choices.
Curated OER
Make Your Own "Weather" Map
Students create their own "weather" map using data from x-ray sources. They analyze and discuss why it is important to organize data in a fashion in which is easy to read. They compare and contrast different x-ray sources using a stellar...
Curated OER
Size Per Unit
Fifth graders investigate how to find the average and the concept of a per unit quantity and its applications. They also make connections of using population density and how to find the speed with its relating formula. This is bringing...
Curated OER
A Real Difference
Fifth graders use the Celsius and Fahrenheit thermometers to compare temperature readings. They use the Internet to find the temperatures of selected cities. After data is collected for five days, 5th graders graph the temperatures.
Curated OER
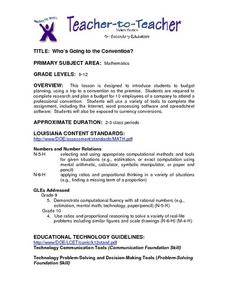
Who's Going to the Convention?
High schoolers practice planning budgets as they create a budget for ten employees of a company to attend a professional convention. They use the Internet, and spreadsheet software to complete their assignment.
Curated OER
What Toothpaste Do You Use?
Students collect data about their favorite toothpaste and then graph the results of that data. They survey 15 of their friends to determine which toothpaste they use the most often and then color the graph to reflect the survey results.
Curated OER
Modeling Population Growth
Students investigate the reasons for taking a census and determine the problems that are involved in the process. They examine the population figure for Montana and Lake county before using the information to complete the included...
Curated OER
Follow a Bill!
Students participate in an activity to discover how a bill becomes law in California. In groups, they create a school program based on their own ideas for change. They develop and conduct a survey within their community and present their...
Curated OER
IS A BLUE WHALE THE BIGGEST THING THERE IS?
First graders explore measurement in relation to size of objects.
Curated OER
Graphing With RXTE
High schoolers use data from the Rossi X-ray Tiiming Explorer (RXTE) satellite to analyze and graph.
Curated OER
How Does Temperature Change With Respect To Latitude and Longitude?
Pupils research the concept of predicting the weather. The research focuses on how some weather facts intuitively make sense. Students answer key questions based upon the mathematical concept of covariance.
Curated OER
Classroom Census
Students identify the processes involved in data collection. They decide how census data can be used. Students engage in the data collection process and represent and interpret classroom data. They use scattergrams, arrow diagrams, block...
Curated OER
One Square Foot
Students identify, describe, count, tally, and graph life found in one square foot of land.
Curated OER
High School Mathematics Problems from Alaska: Fire Fighting Crew
Students apply mean, median and mode calculations of firefighter test scores to decide on hiring.
Curated OER
Virtual Field Trip
Students calculate gasoline cost per mile on a virtual field trip. They calculate the gasoline costs and travel time for each of the 2 routes, and record on a data sheet. They use Excel to create data tables for mileage, gasoline...
Curated OER
Virtual Field Trip / Route, Mileage and Gasoline Cost Graphs
Pupils use a spreadsheet program to graph and compare milage, gasoline costs and travel time for two travel routes in their virtual field trip in Michigan. They determine the most economical route based on the graphs and calculations.
Curated OER
Data Analysis & Probability
Students make predictions based on survey results. They calcuate sample proportions. Students estimate the number of voters in their district preferring the democratic candidate using their sample results. They review sample proportions...
Visa
The Danger of Debt: Avoiding Financial Pitfalls
How can our perspectives of borrowing and returning influence the way we view credit? Pupils explore the concept of debt, how it impacts our ability to obtain credit, and finally the ways in which we can work to alleviate debt.
Visa
Buy, Sell or Hold?: An Overview of Investing
Break down the often-daunting topic of the stock market with this resource, in which pupils learn basic terminology regarding buying and selling stocks, as well as the factors that influence how much return individuals can receive on...
Curated OER
Story Problem Writing
Students write story problems which can only be solved with the application of multiplication facts. They write an extra fact that isn't needed to solve. When their partners do the problems, they must cross out the fact that they do need.
Curated OER
Creating A Family Tree
Fourth graders explore their ancestral background while they experience genealogy.


