Curated OER
Barbie Bungee
Middle and high schoolers collect and analyze their data. In this statistics lesson, pupils analyze graphs for linear regression as they discuss the relationship of the function to the number of rubber bands and the distance of the...
Curated OER
Reading Graphs
Working independently or in teams, your class practices connecting graphs, formulas and words. This instructional activity includes a guided discussion about distance vs. time graphs and looking at how velocity changes over time.
Curated OER
Counting in Kindergarten: Make Number Books
Emergent math masters practice 1:1 correspondence, number recognition, and quantity-to-number relationships. They view number flashcards, state the correct number name, and circle the corresponding numeral to represent the number of...
Georgia Department of Education
Analytic Geometry Study Guide
Are you looking for a comprehensive review that addresses the Common Core standards for geometry? This is it! Instruction and practice problems built specifically for standards are included. The material includes geometry topics from...
Curated OER
Cyber Chow Combos
Using a worksheet that's embedded in the plan, elementary schoolers must come up with the most possible combinations of food they can order from the menu on the worksheet. The activity is meant to be done independently by everyone, then...
Virginia Department of Education
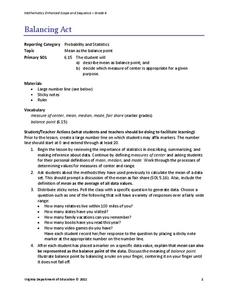
Balancing Act
How many different interpretations of the mean are there? Scholars place numbers on a number line and determine the mean. They interpret the mean as the average value and as the balance point.
K5 Learning
Force
Follow-up a physical science lesson with a reading passage that connects sports to force. Readers respond to six short answer questions that requires them to use the text as a basis for the answers.
Curated OER
Indy 500
Start your engines! Small groups collect data from websites pertaining to the Indianapolis 500 in order to determine average speed per lap and miles in each lap. The lesson requires prior knowledge of the the formula d=rt.
Ohio Department of Education
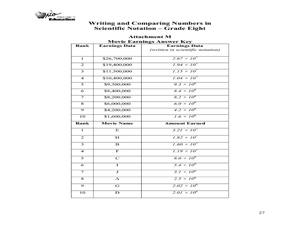
Writing and Comparing Numbers in Scientific Notation-Grade Eight
Explore scientific notation in this mathematics lesson. Young mathematicians explore multiple representations of large number in scientific notation through the use of models, visual representation and expanded form. The lesson provided...
Shodor Education Foundation
Algorithm Discovery with Venn Diagrams
Here is a lesson that takes an interesting approach to analyzing data using box and whisker plots. By using an applet that dynamically generates Venn diagrams, the class forms a strategy/algorithm for guessing the rule that fits...
Charleston School District
Constructing Reflections
An informative video and handout provide the basic information needed to reflect any pre-image across either of the axes on the coordinate plane. The printed resource provides a preview of reflecting across lines other than an axis....
Institute of Electrical and Electronics Engineers
Spring Scale Engineering
After examining how a spring scale works, teams work together to design their own general measurement device. Reading material provides background information, but there is no part of the procedure in which learners handle an actual...
Curated OER
Addition and Subtraction of Fractions
Learners demonstrate how to solve addition and subtraction of fractions. In this fractions lesson, students use folded paper to shade in fractional parts and identify the sum of the parts shaded.
Balanced Assessment
Legos
How many ways can you arrange two six-hole Legos? Scholars practice their understanding of combinations as they investigate this question. As they create a plan, they develop a specific definition of a combination.
Curated OER
Lesson on economic value of education
Students use economic reasoning to analyze both the short-term and long-term benefits and opportunity costs of educational choices, identify incentives that may influence students' career decisions and solve an "economic mystery"
Curated OER
RIP M&M's
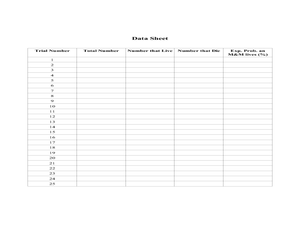
Students solve theoretical probability problems. In this algebra lesson, students apply the concept of probabilities to solving real life scenarios. They collect data and graph it using experimental probability.
Curated OER
Data Analysis and Probability
Students design models to simulate actual events using various random devices. They estimate the likelihood of a particular outcome using results of simulation. In addition, they simulate the births of three children to a using a coin.
Curated OER
Complementary Probability
In this probability learning exercise, students solve complementary probability word problems with 4 problems in them. Students complete 2 problems.
Visa
Money Responsibility
Introduce young learners to the important life skill of responsibly managing money and recording how much they spend and save.
National Council of Teachers of Mathematics
Eruptions: Old Faithful Geyser
How long do we have to wait? Given several days of times between eruptions of Old Faithful, learners create a graphical representation for two days. Groups combine their data to determine an appropriate wait time between eruptions.
Curated OER
Marble Grab Bag: Certainly? Maybe? Impossible?
Second graders use a hands-on activity and a data chart to explain the certainty, probability, or impossibility of drawing a particular color of marble from a bag. This lesson comes with an excellent website, and many good worksheets...
Curated OER
Shake It Up with Scatterplots
Learners identify how to use a scatterplot to compare two sets of data to determine if they are related. Then they identify and describe the definition of regression line (the "line of best fit"). Students also identify how scientists...
Curated OER
Drawing Bugs Game
Second graders explore probability by playing a drawing game with dice. After they roll a die, they draw a tree diagram to illustrate each of the possible outcomes.
Curated OER
Snack Sack
First graders, after exploring agricultural products that can be considered snack foods, experience the concepts of ratio and probability. They analyze and record their class experience after dealing with the following snacks: peanut...


