Computer Science Unplugged
Lightest and Heaviest—Sorting Algorithms
How do computers sort data lists? Using eight unknown weights and a balance scale, groups determine the order of the weights from lightest to heaviest. A second worksheet provides the groups with other methods to order the weights. The...
NASA
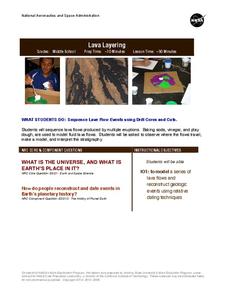
Lava Layering
Take the old baking soda and vinegar volcano to the next level by using it to study repeated lava flows over time, examine geologic features on Earth and Mars, and speculate about some of the formations on Mars.
Bowland
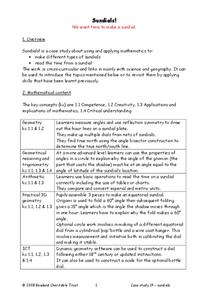
Sundials!
Time to learn about sundials. Scholars see how to build sundials after learning about Earth's rotation and its relation to time. The unit describes several different types of possible sundials, so choose the one that fits your needs — or...
Education Development Center
Area Model Factoring
Introduce learners to what factoring represents and it's relationship to a square with a resource about factoring and the method of area models. The questions are scaffolded to begin with introductory questions and eventually have...
Education Development Center
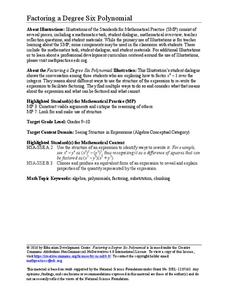
Factoring a Degree Six Polynomial
Within collaborative groups, scholars factor a degree six polynomial. They can factor the polynomial using many different strategies — a great way to prompt mathematical discussion.
Education Development Center
Creating Data Sets from Statistical Measures
Explore the measures of central tendency through a challenging task. Given values for the mean, median, mode, and range, collaborative groups create a set of data that would produce those values. They then critique other answers and...
Education Development Center
Similar Triangles
Model geometric concepts through a hands-on approach. Learners apply similar triangle relationships to solve for an unknown side length. Before they find the solution, they describe the transformation to help identify corresponding sides.
Achieve
Ivy Smith Grows Up
Babies grow at an incredible rate! Demonstrate how to model growth using a linear function. Learners build the function from two data points, and then use the function to make predictions.
Buffalo-Hanover Montrose Schools
Histogram Worksheet
Young mathematicians analyze a given set of numbers to complete a frequency table, and then make a histogram using the data. The worksheet includes three sets of data on the worksheet.
Concord Consortium
Gestation and Longevity
Is the gestation length of an animal a predictor of the average life expectancy of that animal? Learners analyze similar data for more than 50 different animals. They choose a data display and draw conclusions from their graphs.
World Wildlife Fund
Graphs and Charts
A two-part worksheet incorporating bar graphs and pie charts, young mathematicians can practice their graphing skills. Pupils answer questions using graphs and charts but are also challenged to create their own using a given set of data.
Beyond Benign
Green"er" Precipitation Reaction
All sodium carbonate may not have the same amount of carbonate, but it should have the same percent. Learners write and balance an equation to predict the chemical reaction between sodium carbonate and zinc acetate. Through the lab...
Concord Consortium
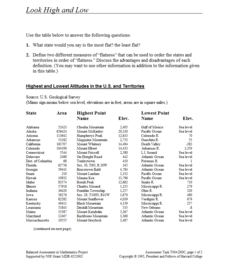
Look High and Low
From the highest high to the lowest low here's a resource that won't fall flat. Given data on the area and the highest and lowest elevations of each of the 50 states, learners decide which states are the least flat and the most flat. Of...
Achieve
Task: Storage Sheds
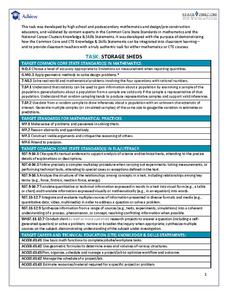
Bridge the gap between mathematics and Career Technical Education. Pupils research the cost associated with building storage sheds and analyze possible profit. They build scale models and determine if building and selling the sheds is a...
Curated OER
Hackenbush: Math Game
In this math worksheet, students collaborate with classmates to play a group problem solving game called Hackenbush. The directions for the game are somewhat confusing.
Curated OER
Math Club Warm-Ups
In this math warm-up instructional activity, students complete a warm up activity, copying know diagrams. Problem is printed 4 per page for copying purposes.
Curated OER
Math Club Worksheet #4b - Warm-up - Let's Practice Counting!
In this counting practice worksheet, students determine how many counting numbers there are between 27 and 93 inclusive. They tell how many multiples of 5 there are between 35 and 75 inclusive.
Curated OER
Milkweed and Monarch Butterfly Mania: Measuring
In this milkweed and monarch butterfly mania: measuring worksheet, students use photos of milkweed plants and caterpillars next to a ruler to estimate the measurements of 10 leaves and 15 caterpillars, calculating and recording...
Curated OER
U.S. and Metric Measurements
In this math worksheet, students analyze a chart that displays the length or distance, square measure, cubic measure, and dry measure and their metric equivalence.
Curated OER
Jelly Bean Sort Record Page
In this Easter themed math worksheet, students sort jelly beans by color and record the number of each on this chart. They fill in 3 blanks by telling which color had the most, which had the least, and which color is their favorite.
Curated OER
Using Multiplication to Solve Problems
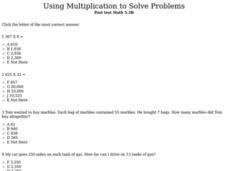
In this interactive multiplication worksheet, students solve ten various problems by using multiplication skills. There are ten multiple choice problems to complete.
Curated OER
Significant Figures
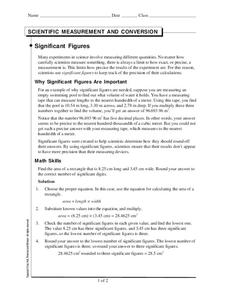
In this significant figures worksheet, students read about how to determine significant figures in calculations and measurements. They practice identifying significant figures in five problems.
Curated OER
Equations with Three Parts
In this equations activity, students practice solving problems using the equation for mechanical advantage. Students complete 2 problems.
Curated OER
Are U Still Nuts?
In this unit conversion activity, students solve 3 problems using conversion factors to find the given measurements in the new unit of measurement.

