Curated OER
You Are What You Eat (High School)
Students evaluate data from a statistical chart or graph which they find in a newspaper or magazine.
Curated OER
Capturing the Wind
Students collect and analyze data about wind speed. They build a Lego wind sail and measure the wind speed with a rotation sensor. They use software to analyze the data.
Curated OER
Descriptive Statistics
Learners demonstrate how to use frequency and scatter diagrams. In this statistics lesson, students are introduced to different techniques of representing data. Learners sort and graph data on a worksheet and use a frequency diagram to...
Curated OER
Central Tendencies and Normal Distribution Curve
Fourth graders are given data (class test scores) to determine central tendencies, and find information needed to construct a normal distribution curve. They become proficient in calculating mode, median and average.
Curated OER
The Guise of a Graph Gumshoe
Eighth graders practice constructing bar, circle, and box-and-whisker graphs. They practice reading and interpreting data displays and explore how different displays of data can lead to different interpretations.
Curated OER
Fly Away With Averages
Students discover the process of finding the mean, median, and mode. Through guided practice and problem solving activities, they use a computer program to input data and create a graph. Graph data is used to calculate the mean,...
Curated OER
Drops on a Penny
Eighth graders experiment to determine the number of drops of water a heads up penny hold. They create a stem and leaf graph of the class results and use the data for further experimentation on a tails up penny.
Curated OER
Paper Tower Challenge
Student explore the challenge of building a tower using paper. They build their tower using paper and record the height of their tower. Young scholars collect and record the heights of other towers and use that data to create a spreadsheet.
Curated OER
The Bigger they Are . . .
Learners do a variety of data analyses of real-life basketball statistics from the NBA. They chart and graph rebounding, scoring, shot blocking and steals data which are gathered from the newspaper sports section.
Curated OER
Graphing Fun
First graders analyze objects and make a graphing picture to analyze the data. For this graphing lesson, 1st graders complete an object graph assessment, a picture graph assessment, and a bar graph assessment to analyze their given objects.
Curated OER
Home on the Range
Third graders see how to find the range of a set of numbers by analyzing data. After a lecture/demo, student pairs practice finding mode and range by solving problems put up on the board by the teacher.
Curated OER
Chart/Graph
Students create a class survey, place the data in a spreadsheet and graph the information.
Curated OER
Bubbles
Eighth graders experiment with a number of dishwashing liquids to determine the duration of the bubbles. They graph the data, add glycerin to the dishsoap, and repeat the experiment. They graph and compare the data sets.
Curated OER
Charting Weight
Sixth graders record the weight of themselves and 3 family over a week, and then use that data to compile 2 bar graphs and 4 line graphs and answer a series of questions.
Curated OER
Determining the Existence of Gender Bias in Daily Tasks
Help your kids explore gender bias. Learners design and conduct a survey examining role responsibilities within families. They determine the percentage of responsibilities for males vs. females and graph the results. Then they analyze...
Curated OER
Get a Leg Up
Traveling through space is an amazing experience, but it definitely takes a toll on the body. After reading an article and watching a brief video, learners perform an experiment that simulates the effects of zero gravity on the...
Curated OER
A Closer look at Oil and Energy Consumption
Upper graders analyze basic concepts about the consumption, importation and exportation of the worlds oil production. They create several graphs to organize the data and draw conclusions about the overall use of oil in the world.
Science 4 Inquiry
The Ups and Downs of Populations
As the reality of population decline across many species becomes real, pupils learn about the variables related to changes in populations. They complete a simulation of population changes and graph the results, then discuss limiting...
Howard Hughes Medical Institute
Color Variation over Time in Rock Pocket Mouse Populations
A species-specific look at natural selection, the resource herein examines how adaptations have helped the population of rock pocket mice survive in a changing landscape. To begin, middle or high schoolers watch a 10.5 minute video,...
Howard County Schools
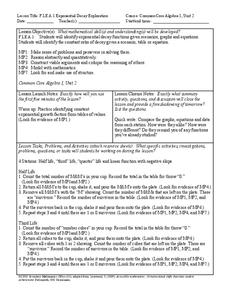
Exponential Decay Exploration
How can you model exponential decay? Explore different situations involving exponential decay functions and decreasing linear functions by performing activities with MandM candy, popcorn kernels, and number cubes.
Kenan Fellows
Using Water Chemistry as an Indicator of Stream Health
Will this water source support life? Small groups test the chemistry of the water drawn from two different sources. They then compare the collected data to acceptable levels to draw conclusions about the health of the source. The...
Curated OER
Amusement Park Physics
Students get up close and personal with principles of motion. In this physics lesson plan, students collect and analyze acceleration data on amusement park rides. Students use CBLs to collect data in this lesson plan.
Curated OER
Show Me!
Students analyze and interpret graphs. In this graphing instructional activity, students view a video and construct their own graphs (line, circle, bar) from given sets of data.
Curated OER
Real Estate Lesson: Monthly Payments
Learners examine real-world data relating to real estate. They conduct Internet research, record data regarding real estate in major cities, graph the data, calculate mortgage payments using a mortgage calculator, and analyze the data.


