Curated OER
Slanted Surveys And Statistics
Students engage in a lesson that is concerned with the use of statistics and surveys and how they should be read. They create a survey and take it home to collect data. Then students display the data on a graph that is displayed in class.
EngageNY
Estimating Probability Distributions Empirically 2
Develop probability distributions from simulations. Young mathematicians use simulations to collect data. They use the data to draw graphs of probability distributions for the random variable in question.
Curated OER
Robot Rounding!
Students collect data on a robot and relate the behavior to prove there is an infinite minute set of numbers. In this algebra lesson, students verify that there is always a number between two numbers. They analyze and make inference...
Curated OER
Using Math Concepts to Collect and Document Specimens
Students determine the length and width of leaf samples to the nearest millimeter and the circumference of trees. They participate in a discussion about the importance of collecting specimens carefully. They compile accurate...
Curated OER
View Tubes
Eighth graders decide if the length of a viewing tube, its diameter, or the distance from an object affects the type of data collected and the resulting graph through a series of experiments.
Curated OER
"who Lives in Your House?"
Fourth graders collect data about the people and animals living in their homes, and the students' shoe sizes. They work in groups to enter the information into a database from which they create graphs. They analyze the data to find the...
Agriculture in the Classroom
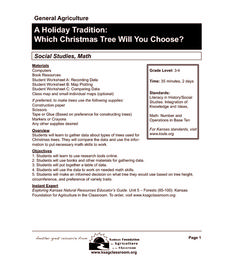
A Holiday Tradition: Which Christmas Tree Will You Choose?
Different varieties of Christmas trees provide an interesting way to combine social studies, science, math, and technology. Class members not only research the history of the Christmas tree holiday tradition, they compare and...
Mathematics Assessment Project
Mean, Median, Mode, and Range
What a find! Here is a lesson, designed to meet sixth grade math Common Core standards, that focuses on the calculation of different measures of center for the scores from a penalty shoot-out competition. An independent...
Curated OER
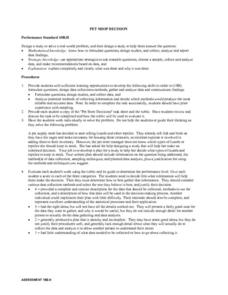
Pet Shop Decision
Students are given the "Pet Store Decisions" task sheet and a rubric that goes with it. Students discuss the task and make a plan for using the rubric sheet to complete the task. Students formulate questions, studies and data collection...
Curated OER
Does Music Cam the Savage Beast?
Students collect, graph and analyze data. In this statistics lesson, students measure the heart beat of a person as they listen to music. They use the CBL and TI to create a graph, analyzing the outcome.
Curated OER
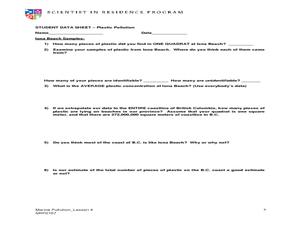
Plastic Pollution
Young scholars determine with math concepts how much plastic pollution is affecting marine life. In this plastic pollution lesson plan, students collect scientific data from a field trip to a water treatment plant.
Curated OER
Active Wear
Middle schoolers interpret and analyze data. In this middle school mathematics lesson plan, students conduct an experiment in which they investigate which solar collector, black, white, or silver, absorbs the most heat. ...
Curated OER
Excavating the Trash
Students look at a day's accumulation of recyclable trash from first through fifth grade classrooms, not knowing which classes it came from. After setting up a collection sheet for data, students remove items from the receptacle and...
Curated OER
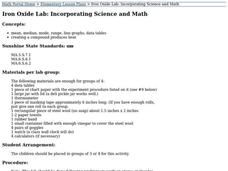
Iron Oxide Lab: Incorporating Math and Science
Students conduct an experiment in small groups, draw conclusions about the amount heat of a compound achieves and practice their data analysis skills.
Curated OER
Applied Science - Science and Math Pre Lab
Students find Fibonacci sequences. In this applied Science lesson, students solve Fibonacci sequence problems. Students explore the mathematical patterns of objects in nature.
Texas Instruments
Data Collection for Bar Graphs
Learners study the concept of central tendency in this data collection for bar graph lesson plan. They collect data outside as instructed and organize it into a bar graphs, then they list in specific groups the labels that appear on the...
Curated OER
All That Corn
Young scholars observe and record data. In this plant growth instructional activity, students plant and grow corn. Young scholars observe the growth of their corn and record their data. Students read corn recipes and...
Curated OER
When the Snow is as High as an Elephant
High schoolers study the concept of mean values using a data plot. Learners enter the given data in the activity to create their data table. They use the data table to calculate the mean of the snowfall percentage provided in the...
Curated OER
Scatter Plots
Seventh graders investigate how to make and set up a scatter plot. In this statistics lesson, 7th graders collect data and plot it. They analyze their data and discuss their results.
Curated OER
Teaching with Collections
Students examine collections. In these real-world collections lessons, students examine and describe buttons and shells. Students will then sort, classify, and graph items according to various indicated descriptors.
Statistics Education Web
It Creeps. It Crawls. Watch Out For The Blob!
How do you find the area of an irregular shape? Class members calculate the area of an irregular shape by finding the area of a random sampling of the shape. Individuals then utilize a confidence interval to improve accuracy and use a...
Curated OER
Introduction to Flight: A Math, Science and Technology Integrated Project
Seventh graders review graphing procedures and practice locating points using x,y coordinates. Students calculate the areas of the top and bottom surfaces of the airfoil. They construct a test model of the airfoil.
Curated OER
From Curiosity Cabinet to Museum Collection
Students study binomial nomenclature and museum-based research. They create a curiosity box, label the objects in their curiosity box , develop a classification scheme for the objects, and create a database of all objects collected by...
Curated OER
Rising Gas Prices – Compounding and Inflation
Financial literacy skills and exponential models are connected by the compound interest formula in this task centered on inflation calculations. Collaborative learners get experience collecting data from the given websites and exploring...
