Statistics Education Web
The United States of Obesity
Mississippi has both the highest obesity and poverty rate in the US. Does the rest of the data show a correlation between the poverty and obesity rate in a state? Learners tackle this question as they practice their skills of regression....
Curated OER
Countdown Challenge: Right Angles
In this right angle worksheet, students observe a map of the United States of America. They indicate all right angles on the map by using a right angle symbol. Students list the names of the states and identify the number of right angles...
Curated OER
Grid Frame Mapping
Students map and describe small area of the schoolyard and discuss habitats.
Curated OER
N is for Natural State
For any pupils who live in the state of Arkansas, this would be a fabulous educational experience to help them get to know their state better. Through the use of activities in literature, art, mathematics, science, social studies, and...
Curated OER
MAPPING YOUR NEIGHBORHOOD
Students uses atlases, maps, and Web resources to generate and examine maps of their own neighborhoods. This activity serve as background for the map-reading tasks in the next lessons.
Curated OER
Project Whistlestop:Missouri Vacation Learning Unit
Fourth graders reserach the state of Missouri. For this Missouri History lesson, 4th graders plan a vacation to a region of Missouri. Students work in collaborative groups to determine all aspects of the trip. Students use math...
Curated OER
Touring the Regions of the United States
Fifth graders explore the regions of the United States. They use maps, research on the Internet and use measurements and estimations. Students create a presentation using spreadsheets and publishing software.
Curated OER
The Notorious Four-Color Problem
Take a walk through time, 1852 to 2005, following the mathematical history, development, and solution of the Four-Color Theorem. Learners take on the role of cartographers to study a United States map that is to be...
Education World
The African American Population in US History
How has the African American population changed over the years? Learners use charts, statistical data, and maps to see how populations in African American communities have changed since the 1860s. Activity modifications are included to...
Curated OER
From Sea to Shining Sea
Students determine the top 5 commodities for each state. For this agricultural commodities lesson, students label a map of the United States with the state capitals and the top 5 agricultural commodities for each. They compile the...
Curated OER
A More Perfect Union: The Story of Our Constitution
Sit back, relax, and transport to 1787! This lesson plan on the Constitution begins with guided imagery of the Constitutional Convention. The class reads A More Perfect Union: The Story of Our Constitution in an...
Discovery Education
Architects in Action
Hands-on and real-world applications are great ways to teach mathematical concepts. Creative thinkers examine how ratios are used to create scale models of buildings and structures. They practice working with ratios by looking at a map...
Teach Engineering
Where Are the Plastics Near Me? (Mapping the Data)
The last activity in a nine-part series has teams create a Google Earth map using the data they collected during a field trip. Using the map, groups analyze the results and make adjustments to the map to reflect their analysis. A short...
Mathematics Assessment Project
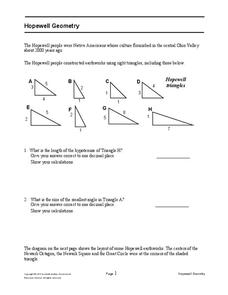
Hopewell Geometry
Right triangles from 2,000 years ago? Learners investigate different right triangles found in the earthworks of the Hopewell people, a Native American culture that populated the United States from 200BC to AD 500. Learners apply concepts...
Curated OER
Quarter Conservation
Here is another in the interesting series of lessons that use the special State Quarters as a learning tool. This one uses the California State Quarter. During this lesson, pupils learn the many ways they can conserve natural resources...
Curated OER
Weather, Data, Graphs and Maps
Students collect data on the weather, graph and analyze it. In this algebra instructional activity, students interpret maps and are able to better plan their days based on the weather reading. They make predictions based on the type of...
Curated OER
Rivers, Maps, and Math
Students use maps to locate and label the major rivers of North and South America. Using the internet, they identify forests, grasslands, mountain ranges and other landforms on the continents as well. They compare and contrast the...
Curated OER
Angles, Bearings and Maps
In this angles, bearings and maps worksheet, students measure angles and classify, calculate the size of unknown angles, and complete related multiple choice and word problems.
Curated OER
Mapping the Transcontinental Journey
Students develop their geography skills. In this Lewis and Clark lesson, students collaborate to calculate the time and distance of different segments of the expedition. Students compare their estimate to Lewis and Clark's.
Curated OER
The Crash Scene
Fifth graders explore geography by participating in a mapping activity. In this engineering instructional activity, 5th graders identify the differences between latitude and longitude and practice locating precise points on a globe or...
Curated OER
Investigation - The Local Bagel Shop
Sixth graders investigate unit pricing to find which cup of coffee is a better buy. They use ratio and proportions to solve problems involving a change of scale in drawings, maps, recipes, etc. Students determine the unit cost of items...
Mathematics Vision Project
Module 7: Connecting Algebra and Geometry
The coordinate plane links key geometry and algebra concepts in this approachable but rigorous unit. The class starts by developing the distance formula from the Pythagorean Theorem, then moves to applications of slope. Activities...
Curated OER
How Far Is It?
Students use a map key to estimate the distance from Salt Lake City, Utah, to ten other cities. Then they use an online distance calculator to see how close their estimates come!
California Academy of Science
California's Climate
The United States is a large country with many different climates. Graph and analyze temperature and rainfall data for Sacramento and Washington DC as you teach your class about the characteristics of Mediterranean climates. Discuss the...
Other popular searches
- United States Maps
- United States Maps Regions
- Northeast United States Maps
- 50 United States Maps
- Create United States Maps
- Western United States Maps
- Custom United States Maps
- Outline Maps United States
- Blank United States Maps
- United States Landforms Maps
- United States Geography Maps
- United States Political Maps


