Illustrative Mathematics
Electoral College
A cross-curricular resource that takes the electoral votes and allows your learners to organize and analyze the data. Young voters can determine which states are more influential and interpret the dotplot provided for more data....
Illustrative Mathematics
Dimes and Quarters
Here is a coin problem where the algebra learner determines the pair of linear equations needed to solve the system. Whether the equations are taken from a table, or your scholars recognize the format of a coin problem, it is an...
West Contra Costa Unified School District
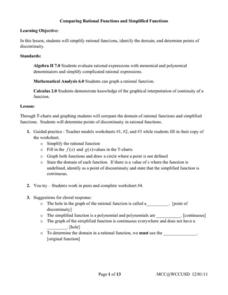
Comparing Rational Functions and Simplified Functions
What kind of functions have holes in their graphs? Here, the teacher guides the class on how to use the simplified function of a rational function to aid in the graphing of the original rational function. T-tables are used in order...
CK-12 Foundation
Distance Between Two Points: Segment Addition
Examine the segment addition postulate through an online simulation activity. An interactive lesson allows scholars to manipulate points and watch as the lengths of segments change. Through their study, they are able to apply the Segment...
Mathematics Vision Project
Module 3: Features of Functions
Learn how to represent functions in multiple ways. Learners analyze functions as equations, graphs, and verbal descriptions. The analysis includes intercepts, behavior, domain, and range. The module of seven lessons makes up the third...
College Board
2004 AP® Statistics Free-Response Questions
Provide some practice showing the work. Pupils work through six free-response questions that require them to show their work. They use their knowledge of statistics to develop solutions to problems within context. Scenarios range from...
Curated OER
Math: O.R.E.O. Woes
In this math worksheet, 3rd graders apply basic operations to answer six questions about Oreo cookies. Next, they create four math problems using pictures and number sentences.
Curated OER
Line Plots - Homework 6.3
Elementary schoolers use data in a table to make a line plot, then answer five related questions. Houghton Mifflin text is referenced.
Curated OER
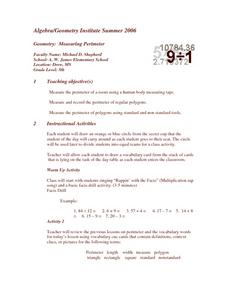
Measuring Perimeter
Have your class practice measuring the perimeter of various objects using this resource. Fifth graders place various-sized polygons in order (from largest to smallest). They use non-standard measuring tools to estimate the distance...
Mathed Up!
Histograms
Class members explore how to read and use histograms by watching a video on creating and analyzing histograms. To finish, the class works on a set of questions that tests these skills.
Curated OER
Multiplication Table: Facts From 1-12
In this multiplication worksheet, students complete a multiplication table with facts from 1- 12. There are some numbers provided as hints.
Curated OER
Table Settings
Fifth graders explore and examine how to make organized lists and find patterns to help them solve problems. They identify, analyze and determine a rule for predicting and extending numerical patterns involving operations of whole...
Curated OER
Linear Piecewise Functions
Students explore the concept of piecewise functions. In this piecewise functions lesson, students graph piecewise functions by hand and find the domain and range. Students make tables of values given a piecewise function. Students write...
Lycoming College
An Author Study of Jan Brett
Jan Brett, the author of many beloved children's books, is well worth a study. Try out this winter-themed unit, which covers areas of language arts as well as art, math, science, and social studies.
Curated OER
Math in Society
Twelfth graders determine probabilities of real-life events such as life expectancies, winning a lottery ticket and the break-even premium. They apply how life-expectation tables are used to estimate the probability that an individual...
Curated OER
Making Connections
Seventh graders relate patterns with higher math. In this 7th grade math lesson, 7th graders analyze different methods of portraying data. They relate the data to real life scenarios.
Curated OER
New York State Testing Program Grade 8 Math Sample Test 2005
For this New York state sample test worksheet, 8th graders solve thirty-three sample math problems designed to help students prepare for the grade eight math test. Tips for taking the test are provided.
Curated OER
Worksheet 15-Fall 1995
In this math worksheet students use the intermediate value theorem to solve two problems. They find parallel lines that will cut a convex shape into two pieces with equal areas. Students repeat this problem with a concave shape. Students...
Curated OER
Making Lists
In this making lists worksheet, students make a list of the 12 months of the year in a table given. A website reference for additional resources is given.
Curated OER
Double Bar Graphs - Practice 7.1
In this double bar graph worksheet, students make a double bar graph from given information, then solve related problems in addition to 2 test prep problems. Houghton Mifflin text referenced.
Curated OER
Cool Tools to Solve Challenging Word Problems
Students explore math functions by completing worksheets in class. In this word problem lesson, students read the story A Remainder of One and practice solving division problems from the story. Students complete a worksheet which...
Curated OER
Maths with the Mob - Aboriginal Culture
Students read and discuss books about aboriginal family life. Working individually and in groups, they complete a series of activities in various subject areas, including art, language, math, and social studies. Among the activities ...
Curated OER
Energy Choices
Young scholars figure the best gas prices. In this math lesson, students add and multiply with decimals. Young scholars complete a worksheet to find which supplier offers the best gas prices.
Curated OER
Using Parallel Axes To Discover Mathematical Interconnections
In this math worksheet, students graph the functions on parallel axes and observe the location of the slope point in relation to the x and y axes.


