Curated OER
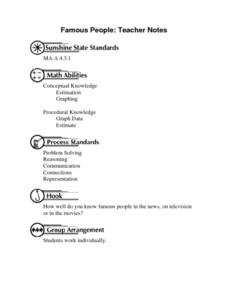
Famous People: Teacher Notes
Young statisticians practice creating scatter plots. First, they estimate the age of 14 people. Next, they write down the estimate in a table labeled x. Then write down their actual age in the table labeled y. Using these x and y...
Curated OER
Writing Equations
In this writing equations worksheet, 9th graders solve and complete 20 different problems that include writing an equation and finding a solution for each problem. First, they read the problem through and write an equation that best...
Curated OER
Applications of the Pythagorean Theorem - Magnetism
Middle and high schoolers use the Pythagorean Theorem to complete a table showing with the magnetic field strengths in given cities. They find the average value of the Earth's magnetic field and plot one of the three-dimensional values...
Curated OER
Probability: What's Most Likely?
Work with graphs, tally marks, and probability. Fifth graders read tables with different sets of data, including tally marks and a bar graph, to answer five questions. Use this worksheet as part of a probability lesson, or as a homework...
Curated OER
Basketball Bounces, Assessment Variation 2
This un-scaffold summative assessment tasks learners to use the height of a bouncing basketball, given the data in graph and table form, to choose the model that is represented. Learners then use the model to answer questions about...
Curated OER
Basketball Bounces, Assessment Variation 1
This highly scaffolded, summative assessment tasks learners to choose the model that represents the height of a bouncing basketball given the data in graph and table form. Learners then use the model to answer questions about the...
Curated OER
Sandia Aerial Tram
Your learners analyze a table of real-life data in order to write an equation that best models the information. Exponential, quadratic, and linear rates of changes are all possibilities in this task.
CCSS Math Activities
Patchwork
Patch up any misconceptions about writing functions. Scholars undertake a performance task that has them first examine a pattern in patchwork cushions. They represent the patterns in triangular and rectangular blocks using a table and as...
Curated OER
Sitting across from Each Other
What is the probability that two randomly seated people will be across from each other at a square table? Check learners' understanding of theoretical probability and compound events with this short assessment. A great opportunity to...
Illustrative Mathematics
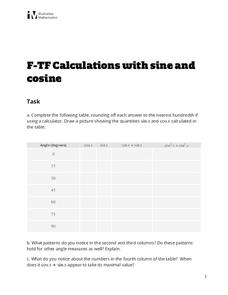
Calculations with Sine and Cosine
Practice makes perfect and perfecting those trigonometric functions are vital in trigonometry. The task requires evaluating cosine and sine values at common degree measures before looking at the results. Is there a pattern when the...
Mathematics Assessment Project
Suzi's Company
Don't use an average resource ... use this one. As a middle school assessment task, learners first determine mean, median, and mode of salaries given in a frequency table. They then investigate how a change in one value changes the...
Curated OER
Data Analysis and Probability: Graphing Candy with Excel
Collect and graph data using Microsoft Excel with your math class. They will make predictions about the number of each colored candy in a bag of M&M's, then sort, classify, count, and record the actual data before using Excel to...
EngageNY
Polynomial, Rational, and Radical Relationships
This assessment pair goes way beyond simple graphing, factoring and solving polynomial equations, really forcing learners to investigate the math ideas behind the calculations. Short and to-the-point questions build on one another,...
Curated OER
Cutting Expenses
Learners explore budgeting. In this finance and math lesson, students brainstorm ways in which households could save money. Learners view websites that give cost reducing ideas. Students complete an expense comparison chart and use the...
Illustrative Mathematics
Fruit Salad
Playing with values in this fruit salad problem allows learners to find out how many cherries were mixed in. Your middle schoolers can organize their thoughts in a chart before going into the equation. Eigth graders can skip the chart...
Illustrative Mathematics
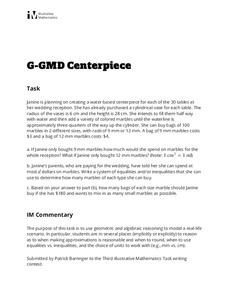
Centerpiece
Learners hear wedding bells in this problem set, as they help a fictional bride plan the centerpieces for her wedding reception. Algebra is married to geometry as volume, aesthetics, and budgeting all come into play. Learners are...
Curated OER
The History of Mathematics
Research the interrelationship between math and science. Search the Internet to discover the history of several branches of mathematics and make text-to-world connections between the concepts covered in each branch with related...
Curated OER
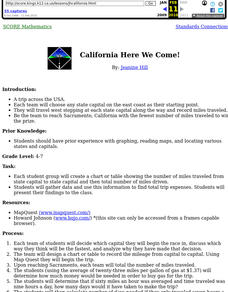
California Here We Come!
A highly relevant and great cross-curricular project! In teams, your class will plot a course from the East Coast to Sacramento, California passing through all of the state capital cities along the way. As part of the journey, teams...
Curated OER
Density
Learners predict when an object will float or sink based on comparison of density of the object to the density of the substance in which it is placed. The access a website and sketch the object in the first column of their table and then...
Curated OER
Profitable Soda Stand
Am I making any money? Help learners determine if their fictitious soda stand is turning a profit. They graph linear equations using the slope and y-intercept and identify the best price to use to sell soda. They identify the domain and...
Yummy Math
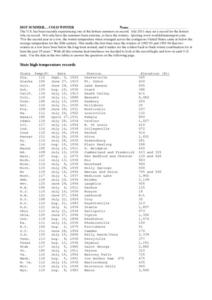
Hot Summer. . . Cold Winter
A table of each state's record temperature reports data that middle schoolers can place on a number line for analysis. A written explanation of how to use this tool and the concept of absolute value are also included. Nine questions are...
Centre for Innovation in Mathematics Teaching
Ratio and Proportion
Middle schoolers review the definition and rules for equivalent fractions. Additionally, they are introduced to equivalent ratios. They write examples of ratios from the board, and they come to the board to write the correct equivalent...
Math Mammoth
Comparing Decimals
A two-page assignment walks mathematicians through how to tell which decimal in a pair is greater. The page uses yellow highlight to emphasize the numerals in question, making the lesson much easier to follow. Learners locate decimals on...
Curated OER
Conversions: Length
If my dog is 36 inches long, what is his length in feet? There are 24 measurement-conversion problems here involving inches, feet, yards, and miles. Two example word problems walk learners through this process before they try...
