Concord Consortium
Function Project
What if a coordinate plane becomes a slope-intercept plane? What does the graph of a linear function look like? Learners explore these questions by graphing the y-intercept of a linear equation as a function of its slope. The result is a...
Curated OER
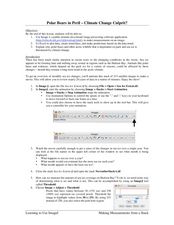
Polar Bears in Peril - Climate Change Culprit?
Students explore the changes in sea ice over several years. In this life science lesson plan, students review and examine 20 years of data. They use Excel to graph data and analyze trends.
Virginia Department of Education
Graphing Linear Equations
Combine linear equations and a little creativity to produce a work of art. Math scholars create a design as they graph a list of linear equations. Their project results in a stained glass window pattern that they color.
Curated OER
Coordinate Planes
Identifying the location of ordered pairs on coordinate planes is the focus in the math lesson presented here. In it, 4th graders are introduced to coordinate pairs, the x/y axis, and the techniques associated with this type of graphing....
Curated OER
Point Comparisons
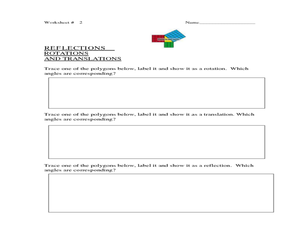
Young geometers investigate two-dimensional figures using coordinate grids. They identify polygons and draw examples of their reflection, rotation, and translation on a coordinate grid. And they complete a worksheet practicing examples...
EngageNY
Coordinates of Points in Space
Combine vectors and matrices to describe transformations in space. Class members create visual representations of the addition of ordered pairs to discover the resulting parallelogram. They also examine the graphical representation...
Curated OER
Art Class, Variation 1
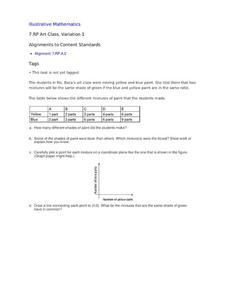
Student statisticians calculate ratios to determine how many shades of green were mixed by Ms. Baca's art class. They graph the number of blue parts against the number of yellow parts for each combination and discover that some produce...
Curated OER
Solving Systems Using Substitution
Write a math story for a series of problems using given variables. The class writes stories, showing understanding of strategies in compound sentences. They then solve the equations.
Curated OER
Integrate Reading and Writing this Valentine's Day
Spend Valentine's Day reading, writing, or creating gifts with your students.
Curated OER
Yakety-Yak
Do talk back! The transcript of one side of a telephone conversation launches a study of dialogue. Class members imagine the response of the speaker on the other side of the conversation and record these responses on the provided...
Curated OER
Relations and Graphs
Here is a simple, yet clever lesson on how to teach the important concepts of greater than, less than, and equal to. Pupils write their names down on grid paper - one letter per box. They compare their names and find a name that is...
Teach Engineering
Can You Resist This?
Some things are hard to resist. Small collaborative groups build circuits and calculate the voltage using Ohm's Law. Budding engineers explore the connection between the voltage across different resistors and linear...
Curated OER
Figurative and literal language through the study of Shakespeare
Sixth graders explore figurative and literal language. They study literary devices through short pieces of Shakespeare's work. Then investigate Shakespeare's works and life.
Curated OER
Personal Poetry: An Introduction to Narrative Poetry
Here are some simple and easy to manage lesson ideas to introduce narrative poetry in your classroom.
West Contra Costa Unified School District
Exploring Quadratics and Graphs
Young mathematicians first graph a series of quadratic equations, and then investigate how various parts of the equation change the graph of the function in a predictable way.
Curated OER
Science: Hurricanes As Heat Engines
Learners conduct Internet research to track the path of Hurricane Rita. They record the sea surface temperature of the Gulf of Mexico during and after the hurricane and draw conclusions about how hurricanes extract heat energy from the...
Curated OER
Tally Time
Students create a tally chart. In this math and health activity, students discuss healthy foods and create a tally chart showing the number of students who like to eat healthy foods.
Curated OER
Plastic Packaging
Students collect data. In this math lesson, students collect data about recyclable materials. Students develop a plan that will help the environment. Recycling plastic containers is discussed.
Curated OER
L-shaped Perimeters
In this perimeter worksheet, students calculate the perimeter of L-shaped figures by subtracting to find missing side lengths. There are 6 questions.
Curated OER
Graphing Favorite Holidays
Students create spreadsheets and bar graphs based on results of survey of favorite holidays.
Curated OER
Childhood Obesity
Students identify a question to generate appropriate data and predict results. They distinguish between a total population and a sample and use a variety of methods to collect and record data. Students create classifications and ranges...
Curated OER
Food Intake and Physical Activity
Fourth graders graph their estimations of caloric intake and caloric expenditures.
Curated OER
Car Maze competition
Students use graphs to calibrate an RCX car. They must then program the car to traverse a maze using their calibrations
Curated OER
How Far Will It Roll?
Students construct a car with the longest roll using a ramp. They construct Lego cars, modify the wheel sizes and car configurations to evaluate which car design rolls the longest distance, develop a graph, and complete a worksheet.

