Curated OER
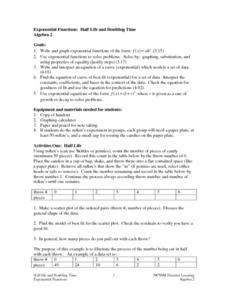
Exponential Functions: Half Life and Doubling Time
High schoolers investigate the concept of exponential functions and how they increase in size over time. They simplify the functions in order to find the solutions that are possible and perform analysis of the curved line that is...
Curated OER
Forests for People
Young scholars devise and conduct a survey at their school to discover what the students like to do in forests. They then plot the results in a line-graph. Young scholars research the various things threatening forest life.
Curated OER
Exploring the Nature of Conflict
Students define conflict and violence, and determine the difference between the two. They find positive aspects of conflict while analyzing a conflict which they experienced. They organize their thoughts using a webbing activity.
Curated OER
Measuring Volume/Capacity Using the Metric System
There is more than one way to measure an amount, as learners discover by applying multiple measurement tools in these activities. Centimeter cubes, cylinders, beakers, and measuring cups are used to find the volume of regular and...
Curated OER
Volume, Mass, and Weight
Study the difference between mass and weight. Your math group will compare the weight of an item to the amount of space that it uses. They'll then use conversion factors to find the difference between kilograms and pounds. Essential...
Curated OER
Is Grandpa Right, Were Winters Colder When He Was a Boy?
Middle schoolers compare current weather data to historic data to see if there is a temperature change. In this weather activity students complete a lab activity and determine average changes in temperature, precipitation and cloud...
David Pleacher
Candy Math Fun
Few things can motivate children to learn like the promise of a sweet and tasty treat. Given a bag of M&M®s, Skittles®, or other colorful candy, students first predict the contents of the bag before counting the pieces,...
Illustrative Mathematics
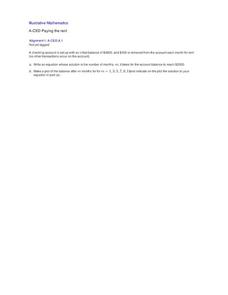
Paying the Rent
Learning how a bank account works is a useful tool. The exercise in the resource is to deduct rent from a checking account and create an equation from a description. Participants then graph the balance of the bank account versus months...
Curated OER
Pick A Number
Elementary schoolers find out which month has the most class birthdays (mode) and which birthday represents the middle point of all the birthdays (median). They gather and organize data to find one number that fairly represents the whole...
Curated OER
Drive the Data Derby
Three days of race car design and driving through the classroom while guessing probability could be a third graders dream. Learn to record car speed, distances traveled, and statistics by using calculation ranges using the mean, median,...
Curated OER
What's in a Graph?
How many yellow Skittles® come in a fun-size package? Use candy color data to construct a bar graph and a pie chart. Pupils analyze bar graphs of real-life data on the Texas and Massachusetts populations. As an assessment at the end...
Purdue University
The Represented World: Recreational STEM
How are forces and motion important to a swing set? Scholars explore the concepts of force and motion using swing sets. In preparation for their own STEM design project, individuals take surveys and data from peers, complete labs on...
Virginia Department of Education
z-Scores
Just how far away from the mean is the data point? Pupils calculate the standard deviation for a set of data and find out how many standard deviations a point is away from the mean. The teacher leads a discussion on how to calculate...
Curated OER
Raisin the Statistical Roof
Use a box of raisins to help introduce the concept of data analysis. Learners collect, analyze and display their data using a variety of methods. The included worksheet takes them through a step-by-step analysis process and graphing.
Curated OER
Special Ed. Resource
Ways to organize data is the focus of this math PowerPoint. Students view slides that define and give descriptions of a variety of graphs, and how mean, median, and mode are found. A good visual tool which should benefit almost all types...
Curated OER
Human Effect
Students investigate changes in air quality. In this science lesson, students compare data to determine the air quality. Students explore how humans affect the air quality.
Curated OER
WHAT IS THE POPULAR COLOR?
Fourth graders graph cars according to their colors. They complete the graph including a title, scale, x-axis, and y-axis. Students collect the data and choose the type of graph to be made.
Curated OER
What's in a Graph?
Learners explore how to use and interpret graphs. The graphs are pulled from a variety of sources, and the activities ask students to interpret graphs. They start this lesson plan with knowledge of what a graph is. Learners also know how...
Curated OER
Rolling with Links
First graders explore geometry by completing a worksheet in class. In this non-standard measurement unit instructional activity, 1st graders discuss different techniques for measuring items without the use of a ruler. Students read...
Curated OER
Building Sets of 13 and 14
Compose and decompose sets of 13 and 14 and compare sets of each with your little learners. They use objects to construct sets of 13 and 14, record their answers, and compare sets in several different ways.
Curated OER
Generate Measurement Data Word Problems
Beginning graphers will appreciate this practice with basic bar graphs. For each table of data, there is a corresponding graph for learners to match it to. The five data sets all have the same two...
Curated OER
Transformation, Reflections, Rotations and Translations
Students create a quilt, using different patterns. In this geometry lesson, students apply prior knowledge as they use different patterns to help them create a quilt using transformations and geometric shapes.
Curated OER
Venn Diagram and UK Basketball
Students analyze data and make inferences. In this algebra lesson, students collect and analyze data as they apply it to the real world.
Curated OER
Moving On Up!
Students complete a game-like simulation to determine a career and salary. In groups, they collect information and decide what is the "best" city in which to live. They create a monthly budget for their "best" city based on salary from...


