American Statistical Association
Colors Challenge!
Does writing the name of a color in a different colored ink affect one's ability to read it? Scholars design an experiment to answer this question. They collect the data, analyze the statistics, and draw a conclusion based on...
Curated OER
Volleyball
Students learn the different ways to pass a volleyball while playing the game. In this volleyball lesson plan, students learn how to serve, bump, and pass a volleyball.
Mathematics Assessment Project
College and Career Readiness Mathematics Test C2
Scholars apply knowledge learned over their high school math courses in order to determine their college readiness. The 20-page resource emphasizes applied problem solving.
Rochester Institute of Technology
Skateboard Performance Testing
Perform an activity on performance testing with a activity focused on the purpose of wheel bearings on skateboards. Learners conduct performance testing on a skateboard to collect and interpret data.
West Contra Costa Unified School District
Sneaking Up on Slope
Pupils determine the pattern in collinear points in order to determine the next point in a sequence. Using the definition of slope, they practice using the slope formula, and finish the activity with three different ways to...
Mathematics Assessment Project
Middle School Mathematics Test 3
Real-life mathematics is not as simple as repeating a set of steps; pupils must mentally go through a process to come to their conclusions. Teach learners to read, analyze, and create a plan for solving a problem situation. The...
Balanced Assessment
Cost of Living
Math scholars investigate the cost of living in Hong Kong compared to Chicago but must first convert the different types of currency. They then choose a type of graph to compare different spending categories and finish the activity by...
CCSS Math Activities
Smarter Balanced Sample Items: High School Math – Claim 2
Problem solve across the content standards. The presentation slides provide 19 sample items from the Smarter Balanced high school assessment. Items illustrate Claim 2, problem solving, of the test and are drawn from all the high school...
Mathematics Assessment Project
Middle School Mathematics Test 4
Raise expectations in your classroom and assess learners through the provided performance tasks. Class members must apply concepts learned throughout the year, providing a good measurement of how well they understand the...
Bowland
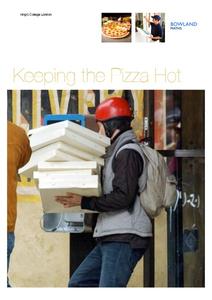
Keeping the Pizza Hot
Learners conduct an experiment to develop a cooling curve for pizza. They consider how this affects pizza delivery in terms of packing material, distance, and delivery routes.
Georgia Department of Education
The Basketball Star
Have learners use math to prove they are sports stars! Assess a pupil's ability to create and analyze data using a variety of graphs. The class will be motivated by the association of math and basketball data.
KIPP 3D Academy
Epic Poetry Unit
The Odyssey is the core text in this unit study of the hero's journey motif. Along the way, kids research Greek and Roman history, mythology, art, and epic poetry. The 104-page packet is perfect for homeschool or classroom situations and...
Curated OER
Stories That Grow on Trees
Students write their own choose-a-plot book. They develop skills in creating plot structure and think through a logical line of story action. They invent characters with striking physical and psychological attributes.
Curated OER
Stories That Grow on Trees
Students create their own plot-choice story after reading and discussing a commercially published plot-choice book.
Curated OER
Hey, Look Me Over!
Students make observations about mealworms using hand lenses, rulers, and cotton swabs. Students complete their own mealworm observation chart, then they share their observations with the class. This is one station out of five in an...
Curated OER
Coordinate Plane
Tenth graders plot points on a coordinate plane. In this geometry lesson plan, 10th graders identify the different quadrants, plots points on a number line and coordinate plane and solve for the midpoint of line segments.
Curated OER
Geometry- Coordinate Plane
Middle schoolers plot points on a coordinate grid. In this coordinate plane lesson, students use a coordinate grid to locate the perimeter points of pictures, identify quadrants and use the coordinate points to draw the picture on...
Curated OER
The Big Bang-Hubble's Law
In this Hubble's law instructional activity, students use data for galaxies which include their distance and speed. Students make a graph to show the distance to each galaxy and the speed of each galaxy. They use their graph to answer 4...
Curated OER
Flight Paths of Orbiting Satellites
Students examine the path a satellite follows as it orbits the earth. For this space science lesson, students use a globe as they illustrate a satellite in its orbital plane, then plot points on the satellite's path on the globe to see...
Curated OER
TEXT MESSAGING
Students examine the differences between standard and non-standard English and use text-speak to rewrite a plot summary and a news story. They identify a type of non-standard English and determine the characteristics that make it...
Curated OER
Literature Analysis
Students examine the attributes of stories. In this literary elements lesson, students discuss the characters, plots, and settings of books they read in class.
Curated OER
Celsius to Fahrenheit
Students convert degrees between two different units. In this algebra lesson, students graph linear equations and identify the line of best fit. They use their line of best fit to make predictions given a set of data.
Curated OER
Spaghetti Graphs
Students work in pairs to test the strength of spaghetti strands. They collect and graph data to determine a line of best fit. Students create a linear equation to interpret their data. Based on the data collected, students predict...
Curated OER
Excel temperature Graphs
Students gather data about the weather in Nome, Alaska. For this Nome Temperature lesson, students create an excel graph to explore the weather trends in Nome. Students will find the average weather and add a trend line to their...


