Curated OER
Least Squares
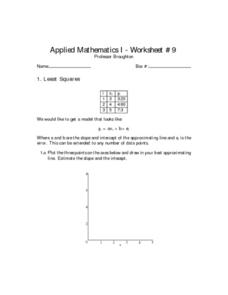
In this least squares learning exercise, students solve 6 different problems that include the least squares of numbers. First, they plot 3 points on the axes shown and draw in their best approximating line. Then, students estimate the...
Curated OER
Coffee and Crime
Is there a correlation between the number of coffee shops and the amount of crime in a given area? In this quick exercise, your class will examine the data, interpret the results, and discuss their conclusion. Concepts covered include...
Curated OER
Why Doesn't My New Shirt Fit?
Learners test Leonardo da Vinci's view of the human body by measuring various body parts using a tape measure. They create a data table and a scatter plot and then analyze and interpret the results using a graphing calculator.
Curated OER
Coordinate Geometry
Grab your class and get them graphing polygons on a coordinate plane! They investigate the four quadrants, discover the x and y axis, and correctly plot ordered pairs. To show their comprehension, each child creates a coordinate picture...
Lesson Locker
Hamlet: Act 2 Questions for Study
A set of explorations for the two scenes of Act 2 of Hamlet. The inquires cover the essentials of the plot. The answers could be found by reading a detailed summary or Cliffsnotes. It is useful for checking reading...
Curated OER
Hyperbolas
Students engage in a lesson that covers the concepts related to the graphing of hyperbolas looking at topics like foci, center, vertices, and asymptotes. They find multiple different points in the coordinate plain and then plot the graph.
Curated OER
Finding Equations
Students make equations from everyday data. They create a graph from the equations. Students predict and analyze the results. Students complete the second scenario on their own and turn in their handout.
Curated OER
Texting and Grades II
Given the least squares regression line, interpret the slope and intercept in the context of the relationship between texting and GPA. Although this task is short and looks simple, some subtle points can be brought to light in a...
Curated OER
Functions and Their Graphs
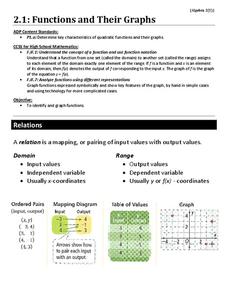
Use a worksheet to go over the basic concepts of relations and functions. Included are clear definitions and examples of relations, domain and range, and functions and the vertical line test. However, the problems are pretty...
Curated OER
Beloved Test
Which character in Toni Morrison’s Beloved personifies evil? What does Seth overhear Schooteacher instruct his pupils to do? The 50 multiple choice and matching questions on this exam focus on points of plot; therefore, test takers could...
Curated OER
Algebra 1
Students study the functional relationships of a variety of problems. In this functional relationship instructional activity, students determine the dependent and independent quantities of a given set of data. Students record...
Curated OER
"We Didn't Start the Fire"
Students extract geographical and historical information from the lyrics of a popular song, make associations between people, places, and events, and plot their information on a map.
Curated OER
Goldilocks and the Coordinate Grids
Where this lesson idea is lacking in materials, it makes up for with creativity! Using "Goldilocks and the Three Bears" as the background, mathematicians plot points on a coordinate grid to create props for the story. The polygons all...
Curated OER
Graphing My Path to Success
Seventh graders examine their school performance through self-assessment of strengths and weaknesses. They construct a line graph, plotting all courses and achievements. Students use graph paper and colored pencils for each activity. If...
Shmoop
ELA.CCSS.ELA-Literacy.RL.11-12.5
What would happen if I structured this review by beginning in the middle of it? Or by flashing back to the dinner I had last night that gave me bad heartburn, and then transitioned into how the lingering burn of acid seeped into my...
Curated OER
Eudora Welty's "A Worn Path" in Graphical Representation
Students analyze graphical forms of Eudora Welty and interpret the shorts stories in the representations. For this graphical representations lesson, students analyze the short story genre in comic strips. Students then create their own...
Curated OER
Tempest in the Lunchroom
Students act out opening shipwreck scene of The Tempest, or watch and direct others doing it.
Curated OER
Grasping Graphs
In this grasping graphs worksheet, students solve and complete 3 different types of problems. First, they graph the data described and select the appropriate graph type. Then, students identify the independent and dependent variable. In...
Curated OER
Graphing Scatterplots
Students examine scatterplots and determine the equation of a line using the slope-intercept method. Students interpret graphs, draw inferences, and sketch a curve of best fit for the graph. Based upon patterns in the graphs, students...
Curated OER
Cinco De Mayo
Students make a graph identifying the immigration of Mexicans to the US. In this algebra lesson, students practice graphing as they review different trends in immigration over the past 100 years. They interpret and analyze their graphs.
Curated OER
Physics: Visualization of Hydrogen Wave Functions
Students explore various methods for visualizing the results of hydrogen wave function. They observe trends using a polar plot tool and make plots for the first three energy levels of the radial wave function for hydrogen. Students apply...
California Education Partners
Science Fair Project
Plant the data firmly on the graph. Given information about the growth rate of plants, pupils determine the heights at specific times and graph the data. Using the information, scholars determine whether a statement is true and support...
EngageNY
End-of-Module Assessment Task: Grade 8 Module 6
Test your knowledge of linear functions and models. The last installment of a 16-part module is an end-of-module assessment task. Pupils solve multi-part problems on bivariate data based on real-world situations to review concepts from...
Rice University
Introductory Statistics
Statistically speaking, the content covers several grades. Featuring all of the statistics typically covered in a college-level Statistics course, the expansive content spans from sixth grade on up to high school. Material...


