Howard Hughes Medical Institute
Spreadsheet Tutorial 5: Histogram
A professional-looking histogram is just a few clicks away. The last installment of a five-part Spreadsheet Data Analysis series focuses on histograms. Learners work through a tutorial to see how spreadsheets can help make frequency...
Beyond Benign
Water Bottle Unit
How much plastic do manufacturers use to create water bottles each year? The class explores the number of water bottles used throughout the years to determine how many consumers will use in the future. Class members compare different...
Texas Instruments
Light and Day
Pupils explore the concept of collecting data as they collect data on their graphing calculator about time, temperature, and light. Learners plot the data and create histograms and box and whisker plots to analyze the data.
Beyond Benign
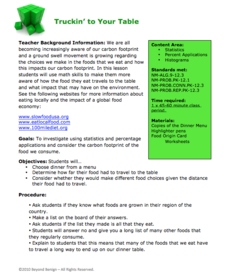
Truckin’ to Your Table
Food takes a trip to the table. Class members choose a meal from a menu and calculate the total cost of the meal including tax and tip. Using a food origin card, pupils determine how far each of the ingredients of a meal traveled to end...
Curated OER
Mass/Weight/Data/Graphing-What Is The Mass of a Dinosaur?
Students determine the mass of various "dinosaur eggs" and graph their data. In this mass, weight, data and graphing lesson plan, students measure the mass of different weighted "dinosaur eggs". They record their data and transfer it to...
Curated OER
Does One Tree a Forest Make?
Students take a walk around the schoolyard looking at and identifying the trees. One leaf for each tree is collected. A chart is developed that represents the population of trees on the school ground. They keep journals and write an essay.
Teach Engineering
Breathing Cells
Pairs work together to determine whether unknown solutions are either acids or bases by using a red cabbage indicator solution. After determining the general pH of the unknown solution, classmates blow into the same indicator after...
Curated OER
Getting the Lead Out
The article for this activity no longer accessible through the links in the lesson plan, but can be found in the National Center for Biotechnology Information website. After reading it, environmental science students answer questions and...
NASA
Analyzing Tiny Samples Using a Search for the Beginning Mass Spectrometry
Teach the basics of mass spectrometry with a hands-on lesson. The fourth in a series of six lessons explores how mass spectrometry measures the ionic composition of an element. Learners then compare and contrast relative abundance and...
Curated OER
Using Color as Defense
Learners explore mimicry and crypsis, participate in hands-on predator-prey activity, and practice calculating averages and graph results in histogram.
Curated OER
The Millikan L'Eggs Experiment
Students discover a pattern to mysterious eggs made by their teacher. In this mass lesson, students must uncover a secret pattern given plastic eggs and a balance. Students find the eggs have been created with a pattern and draw...
Curated OER
Alcohol Use, Abuse, and Alcoholism
Students examine influences contributing to alcohol use and abuse. They asses the genetic and environmental factors involved in alcoholism. They create a histogram for modeling alcohol use and calculate the results into percentages of...
Curated OER
Carbon Dioxide Heats It Up
Students design an investigation to test whether vegetation in an area helps regulate the ambient air temperature. They make comparisons between the investigation and global changes in climate. In groups, they present their findings to...
Curated OER
Paper Parachutes
Students participate in a simulation of a parachute-jump competition by making paper parachutes and then dropping them towards a target on the floor. They measure the distance from the point where the paper parachute lands compared to...
Curated OER
Building a Pill Bug Palace
Learners make "pets" of isopods (potato bugs) to determine their preferred environment and food sources. They record their results on a bar graph and in a scientific report.
Curated OER
FLIGHT FAIR
Students conduct their personal investigations into paper airplane flight. Cooperative teams are formed, with students choosing the paper airplane design that they are most interested in building.
Curated OER
Oh Deer!
Learners discuss the components necessary to keep animal populations alive . Then they participate in a game where they interact as deer, food, water, and shelter. The activity demonstrates that nature is not static, but changes with the...
Curated OER
The Seed and I
Young scholars examine the patterns and structures of seeds and fruits. Using different types of organisms, they identify the similiarities and differences between them. They create their own seed design and shares it with the class.
Curated OER
Mapping River Statistics
Students research different statistics to do with the Mississippi River. They answer questions about finding data and collect it by conducting research. The research is used to construct a data table. Then students use the table to...
Curated OER
Comparison of Snow Cover on Different Continents
Students use the Live Access Server (LAS) to form maps and a numerical text file of snow cover for each continent on a particular date. They analyze the data for each map and corresponding text file to determine an estimate of snow cover...
Curated OER
Aruba Cloud Cover Measured by Satellite
Students analyze cloud cover and to compose written conclusions to a given related scenario. They submit a letter of response and a report detailing their calculations and conclusions.
Curated OER
Plants and Shadows
In this science worksheet, students design an experiment to measure the effects of sunlight exposure upon plants while comparing the amount of shade as a correlation.
Curated OER
Structures Of Life
Learners investigate the basic conceptual structures of plants, with the focus being the parts that contain seeds. They comprehend that organisms that have fruit for the holding of seeds for replication of the species. The students work...
Curated OER
Snow Cover By Latitude
Pupils examine computerized data maps in order to create graphs of the amount of snowfall found at certain latitudes by date. Then they compare the graphs and the data they represent. Students present an analysis of the graphs.


