Curated OER
Logarithmic Transformations of Data
Students investigate and study logarithmic equations. In this precalculus lesson, students analyze the data behind the function. They define each graph as positive, negative or no correlation. They find the line of best fit.
Curated OER
Normal Probability Plot
Students analyze the graph of a distribution. In this statistics lesson, students define skewed or mound shape distribution as they investigate the data behind the graph. They define and plot outlier as well as normal probability.
Curated OER
Looking Normal
Students identify the shape of a function. In this statistics instructional activity, students plot the data collected. They analyze their data for positive, negative or no correlation. They find the line of best fit.
Curated OER
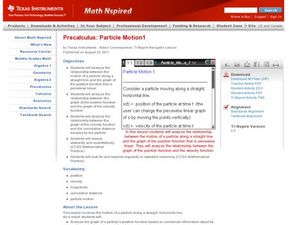
Particle Motion1
Learners analyze piecewise functions. In this precalculus instructional activity, students identify the position, velocity and distance. They analyze the relationship between the graph, its position and velocity.
Curated OER
Center of Mass
Students identify the geometric mean of their data. In this statistics lesson, students collect data and graph their findings. They identify the mean, range and mode.
Curated OER
Not So Snappy 10
In this order of operations (i.e., addition, subtraction, multiplication, division) learning exercise, middle schoolers solve 3 word problems demonstrating their understanding of the concept.
Curated OER
How Does a Spring Scale Work?
Students create visuals of the effect of a spring scale. In this algebra instructional activity, students use the navigator to graph the effects created by a spring scale. They draw conclusion from the graph.
Curated OER
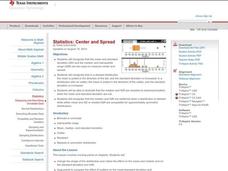
Center and Spread
Students collect and analyze data. In this statistics lesson, students define and calculate the range, median and standard deviation. They identify reasons for a skewed distribution.
Curated OER
What is a P-value?
Students test the hypotheses using p values. In this statistics activity, students define and examine conditional probability. They test each statement for a true statement or a false statement, based on the sample size.
Curated OER
Visualizing Solids of Revolution - Washers
Students solve the area of a cross section. In this calculus lesson, students solve areas rotated and bounded by two functions. They solve using the washer method.
Curated OER
Z-Scores
Students solve problems by identifying the percent of area under the curve. In this statistics lesson, students discuss z-scores as they calculate the different percentages under the bell curve. They calculate the standard deviation.
Curated OER
Scale Basketball
Students understand that a spreadsheet can be used to find the best scale to use in a model. They place the distances of the planets of the solar system to the Sun in one column of the spreadsheet. Students try different scales so that...
Curated OER
Grasping Graphs
In this grasping graphs worksheet, students solve and complete 3 different types of problems. First, they graph the data described and select the appropriate graph type. Then, students identify the independent and dependent variable. In...
Curated OER
The Gingerbread Man - Cutting in Half
Students use the gingerbread man that they made earlier in the day. They demonstrate how to cut the gingerbread man in half, leaving two fair shares or two pieces the same. The gingerbread man pattern is imbedded in an attached file in...
Curated OER
Cooking Up Fractions
Students study fractions through recipes. They rewrite recipes multiplying and changing numbers. They research the Internet for recipes and rewrite fractions to indicate a particular serving. They rewrite directions to change the numbers...
Curated OER
Summer Machines Activity: Cool Tools
Students examine and think about various tools in their surrounding environment to facilitate development of their primary observation and sorting skills. In this tool observation lesson, students first sort a variety of tools any way...
Curated OER
The Lake Effect
Fourth graders conduct an experiment demonstrating the effects of water and air temperature on precipitation. They create graphs demonstrating their findings using Claris Works for Kids.
Curated OER
Pizza Fractions
First graders identify a whole and the fractions 1/4, 1/2, and 3/4 using pizza. This is a very nice instructional activity, in that not only do students practice their fractions, they also get to eat the pizza at the end of the...
Curated OER
Flags
Students read You're a Grand Old Flag as well as other provided books about flags. In this flag lesson, students cut, decorate and bake cookies as flags, practice the letter f, the number 4, the rectangle shape and use the color white....
Curated OER
Estimating to Check Results- Reteaching Worksheet
In this estimating to check results reteaching learning exercise, 1st graders examine how to use estimation to check their addition. They apply the steps to solve and check 2 word problems.
Curated OER
Who Hid the Milk Products?
Students study milk products and learn their health benefits. For this milk products lesson, students discuss dairy products. Students participate in a game of milk product identification. Students also discuss categorizing milk by their...
Curated OER
Slider Template
Students identify parameters using a slider template. In this precalculus lesson, students relate a slider to a calculator. It provides the students the opportunity to control the perimeter of the equations.
Texas Instruments
Circle Equations
Students explore the coordinate plane. In this secondary mathematics instructional activity, students follow a set of directions to plot points in the coordinate plane.
Curated OER
Integration Unit: Riemann Sum
Students investigate Riemann Sums. In this calculus lesson, students solve problems involving Riemann sums and Right Riemann Sums.


