Curated OER
Perimeters, Patterns, and Conjectures
Students discover patterns and write conjectures relating to perimeters and polygons. Working in cooperative learning groups, they use manipulatives and graphic organizers to solve problems then answer a series of questions in which they...
Curated OER
String Of Lights
Students collect, graph and analyze data. For this statistics lesson, students compare data using different types of graphs. They make predictions, draw conjectures as they analyze bulbs used in a holiday light set.
Curated OER
Statistics and Shopping
Explore how statistics are used in everyday life. Your soon-to-be savvy consumers use the Internet to find consumer-related statistical information and learn to make wise consumer decisions. Includes links to a practice sheet about data...
California Education Partners
Science Fair Project
Plant the data firmly on the graph. Given information about the growth rate of plants, pupils determine the heights at specific times and graph the data. Using the information, scholars determine whether a statement is true and support...
Curated OER
Investigation - Patterns
Young scholars create a pattern out of pattern blocks. In this math lesson, students work with a partner to investigate the pattern they have. Within that group, young scholars continue to design the pattern by adding the next two...
Curated OER
Rep Tiles
Third graders use pattern blocks of one shape at a time to try to create a similar shape. They compare the perimeter of the new figure with the perimeter of the original shape and look for a pattern. Students use the pattern to predict...
Curated OER
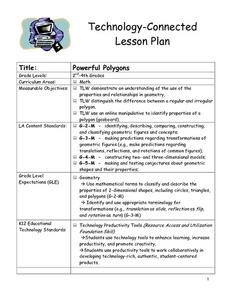
Powerful Polygons
Learners scan the classroom to find different common shapes. They listen as the teacher defines polygon and regular polygon. The teacher demonstrates regular polygons via the Internet and the "Math is Fun" web site. Students go outside...
Curated OER
One, Two, Three...and They're Off
Learners make origami frogs to race. After the race they measure the distance raced, collect the data, enter it into a chart. They then find the mean, median, and mode of the data. Next, students enter this data into Excel at which time...
Curated OER
When Life Serves You Lemons!
Students build their own lemonade stand. In this problem solving instructional activity, students measure the materials needed to build a stand and make lemonade. They find the cost of producing the lemonade and the profit they will make.
Curated OER
Using Data Analysis to Review Linear Functions
Using either data provided or data that has been collected, young mathematicians graph linear functions to best fit their scatterplot. They also analyze their data and make predicitons based on the data. This instructional activity is...
Curated OER
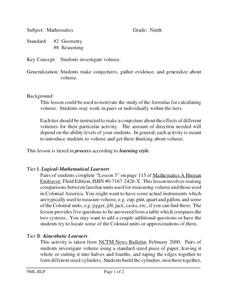
Investigating Volume
Ninth graders investigate and make conjectures about volume. In this geometry lesson, 9th graders analyze data and predict the outcome. They calculate volume using different tiers.
Curated OER
Evaluating the Products of Chords of a Circle
Learners investigate chords and make predictions. In this geometry lesson, students graph circles and calculate the measurement of each chord. They perform the calculations and make conjectures.
Curated OER
Statistics and Shopping
Learners examine statistics and data analysis concepts from the practical questions that arise in everyday life.
Curated OER
Arithmetic Chains
Students complete a chain of numbers given the outcome. In this geometry lesson, student use deductive and inductive reasoning to solve problems. They create a formula and ways to predict numbers in the chain without starting over.
Curated OER
Let's Get Physical
Learners collect data using the CBL. In this statistics lesson, students predict the type of graph that will be created based on the type of activity the person does. The graph represents heart rate depending the level of activity.
Curated OER
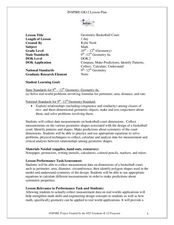
Geometric Basketball Court
Students calculate the area and perimeter of a basketball court. In this geometry lesson, students differentiate between similarity and congruence of geometric objects. They test conjectures and use it to solve problems.
Curated OER
Famous Mathematicians/Database
Students analyze a math database and uncover facts. In this algebra lesson plan, students investigate the lives of famous mathematicians using facts they find about the different authors. They gain a new perspective for the...
Curated OER
Studying Special Segments in Triangles
Students investigate special segments in triangles. In this geometry lesson, students graph, compare, estimate and predict findings based on their data. They differentiate between similarity and congruence of triangles.
Curated OER
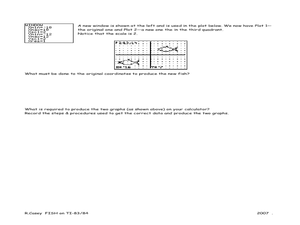
Fishing for Points TI-83/83 Plus
Ninth graders investigate the Cartesian coordinate plane. In this Algebra I lesson, 9th graders explore the coordinates of a drawing of a fish and examine the effects of moving the drawing on the ordered pairs. Students predict the new...
National Council of Teachers of Mathematics
Eruptions: Old Faithful Geyser
How long do we have to wait? Given several days of times between eruptions of Old Faithful, learners create a graphical representation for two days. Groups combine their data to determine an appropriate wait time between eruptions.
Curated OER
What Happens on Average
Fifth graders are introduced to convergence of sequences based on averaging previous terms in the sequence. The power of the "fill-down" function in spreadsheets is exploited. By using various starting numbers, and inferring the limit,...
Curated OER
An Apple A Day
Students create a graph that showcases their pick for favorite kind of apple. Students are given samples of a variety of apples to determine their favorite in a taste test. They a create a tally chart of favorite kinds apples and use a...
Inside Mathematics
Archery
Put the better archer in a box. The performance task has pupils compare the performance of two archers using box-and-whisker plots. The resource includes sample responses that are useful in comparing individuals' work to others.
Noyce Foundation
Ducklings
The class gets their mean and median all in a row with an assessment task that uses a population of ducklings to work with data displays and measures of central tendency. Pupils create a frequency chart and calculate the mean and median....


