West Contra Costa Unified School District
Comparing Rational Functions and Simplified Functions
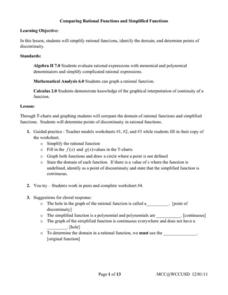
What kind of functions have holes in their graphs? Here, the teacher guides the class on how to use the simplified function of a rational function to aid in the graphing of the original rational function. T-tables are used in order...
Point Pleasant Beach School District
Parabola Project
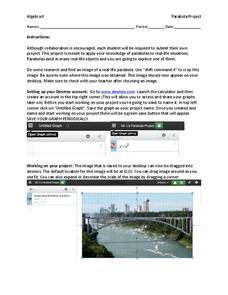
Class members select a picture that contains a parabola and construct a drawing of it using function graphs in the quadratic project. Individuals restrict the domains of the functions to create a more accurate drawing. They then submit a...
West Contra Costa Unified School District
Solving Systems of Inequalities
Don't throw away those transparency sheets just yet! Young scholars first review inequalities on a number line, then learn about graphing inequalities in the coordinate plane. Finally, they use overhead transparencies to create systems...
Curriculum Corner
7th Grade Math Common Core Checklist
With so many math standards to fit into a school year, it can be difficult keeping track of what you have and have not covered. This collection of Common Core checklists allows you to maintain a running record of when each...
EngageNY
Solution Sets to Simultaneous Equations (part 1)
How are systems related? Build on your pupils' previous knowledge of solving systems of equations by introducing systems of inequalities. Learners explore similarities between systems of equations and inequalities to make a strong...
Curated OER
Pies and Percentages--Learning About Pie Graphs
In this pie graph activity, students draw a pie graph for the zookeeper with the data he collected, choose a different color for each animal species and make a key to the graph.
Curated OER
Graphing Candy-Coated Chocolates
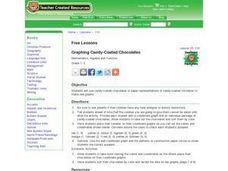
Students place pieces of candy on their coordinate graphs as the teacher calls out the colors and coordinates embedded in the plan. The teacher circulates around the class to check each student's answers for accuracy.
Curated OER
I want a credit card--or do I?
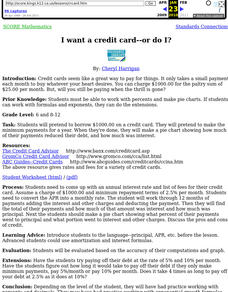
Students pretend to borrow $1000.00 on a credit card. They pretend to make the minimum payments for a year. When they're done, they make a pie chart showing how much of their payments reduced their debt, and how much was interest.
Curated OER
Taxicab Metric, Circle
Students create a circle using the taxi-cab metric. In this geometry lesson, students identify the properties of circles. They identify the idea of geometric shapes and how they come about.
Curated OER
Using Averages to Create Graphs Through Excel
Sixth graders create and use a spreadsheet to make graphs which will be used to analyze Progress Report and Final Report Card grades. They practice finding the mean, median, mode, and range of a data set. Students also incorporate column...
Curated OER
Graphing Fun
First graders analyze objects and make a graphing picture to analyze the data. In this graphing lesson, 1st graders complete an object graph assessment, a picture graph assessment, and a bar graph assessment to analyze their given objects.
Curated OER
Bar Graphs
Third graders examine the main parts of a bar graph and how to round up to the nearest tenth. They make an example of a bar graph and answer questions based on the graph using a list of state capitals and their average temperatures....
Curated OER
Getting Graphs: Researching Genealogy-A Piece of Pie
Third graders research their genealogy. In this math lesson, 3rd graders collect data and create graphs and charts. A presentation of their findings is given.
Curated OER
Pet Count Excel Graphing
Students used collected data to distinguish what pets they have or would like to have. They correlate findings with appropriate technology--Excel. At the end of the lesson they tabulate a bar chart and present their findings to the class.
Curated OER
Skittle it Up
Students make a graph. In this graphing and Excel instructional activity, students work in groups and are given a bag of skittles. Students count the number of each color skittle and create a table in Excel. Students learn how to make a...
Curated OER
Time Management: Piece of Pie
Learners examine their own lives and how well they manage their time outside of school. In this this time management instructional activity, students discover the amount of time they spend on other activities, and create a pie chart with...
Virginia Department of Education
Curve of Best Fit
Which function models the data best? Pupils work through several activities to model data with a variety of functions. Individuals begin by reviewing the shapes of the functions and finding functions that will fit plotted data points. By...
EngageNY
Polynomial, Rational, and Radical Relationships
This assessment pair goes way beyond simple graphing, factoring and solving polynomial equations, really forcing learners to investigate the math ideas behind the calculations. Short and to-the-point questions build on one another,...
University of California
Seasons Lab Book
Unlock the mystery behind seasonal change with a collection of worksheets and activities. Whether they are drawing pictures of Earth's orbit around the sun or graphing the temperature and daylight hours of different locations...
Curated OER
Budget Making
Learners develop a budget for spending and saving. In this economics lesson plan, students create a budget based on personal, family and government income. They discuss jobs at home and allowances. They discuss how they manage their...
Barnstable Public Schools
Math Relay Races
A plethora of activities make up a cross curricular choice page filled with math games—relay races, dice, and crossword puzzles—a survey challenge equipped with data organization, graphing, a quicksand recipe, Hula-Hoop activity to...
101 Questions
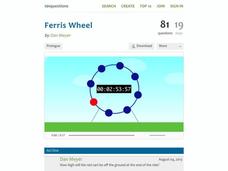
Ferris Wheel
Around and around you'll go! Learners analyze the periodic nature of a Ferris wheel. Using a trigonometric function, they make predictions about the location of a specific car at the end of the ride and its total trips around the circle.
Virginia Department of Education
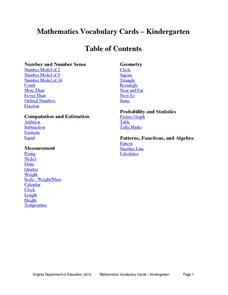
Mathematics Vocabulary Cards - Kindergarten
Enhance your math lesson with a series of pictures that illustrate different math concepts. The vocabulary includes a variety of ideas and pictures including fractions, ordinal numbers, picture graphs, and number lines.
Curated OER
Interpreting and Displaying Sets of Data
Learners explore the concept of interpreting data. In this interpreting data lesson, students make a line plot of themselves according to the number of cubes they can hold in their hand. Learners create their own data to graph and...
