Curated OER
Area Of Sectors
Student find the area of a sector of a circle. For this geometry lesson, high schoolers define the sector of a circle using a sketch. They find and identify examples of sector in the real world.
Curated OER
Mr. Cobbler's Shoe Dilemma
Students employ statistics to solve real-world problems. They collect, organize and describe data. They make inferences based on data analysis. They construct, read, and interpret tables, charts and graphs.
Curated OER
The Statistics of M&Ms
Students explore the topic of statistics with M and Ms. For this math lesson plan, students use candy pieces to sort and gather information needed to create a bar graph. This lesson can be adapted to accommodate students in grades 1-12.
Curated OER
Keep It Cool
Students complete a science experiment to study insulation, heat transfer, and permafrost. In this permafrost study lesson, students design and test a soda insulator. Students graph their class data and discuss the results. Students...
Curated OER
Learning to Spend, Learning to Give
Young scholars explore the concept of personal finances. In this personal finances lesson, students identify their income and expenses. Young scholars create a budget for their spending, saving, investing, and donating habits. Students...
Curated OER
Third Grade Math
In this math review worksheet, 3rd graders answer multiple choice questions about probability, bar graphs, pictographs, and more. Students complete 25 multiple choice questions.
Curated OER
A Bar of Many Colors
Second graders use colored candies to collect data, construct double bar graphs, and find averages.
Curated OER
Paper Parachutes
Students participate in a simulation of a parachute-jump competition by making paper parachutes and then dropping them towards a target on the floor. They measure the distance from the point where the paper parachute lands compared to...
Curated OER
Probability With a Random Drawing
Students define probability, and predict, record, and discuss outcomes from a random drawing, then identify most likely and least likely outcomes. They conduct a random drawing, record the data on a data chart, analyze the data, and...
Curated OER
Learning to Spend, Learning to Give
Students create a monthly budget. In this finances lesson, students learn the terms budget, income and expenses. Students create a monthly spending plan and keep track of what they make and spend for the next 30 days. When complete,...
Curated OER
Grade 5 Math Test
In this grade 5 reading quiz, 5th graders complete a 26 question multiple choice quiz covering a variety of grade 5 reading concepts. Answers may be submitted on-line.
Curated OER
Will There be Enough Water?
Learners investigate water usage, water available, and water demand historically in the local area. They use projections of water usage, availability and demand up to the year 2050. Students use graphs to relate as well as compare and...
Curated OER
Water - Planning for the Future
Middle schoolers explore and examine the increases and/or decreases for water user groups: irrigation, municipal, manufacturing, steam electric power generation cooling, livestock, and mining. They utilize percentage changes during their...
Curated OER
Bullying-studying it to curb it....
Students will engage in a variety of research activities to write what the latest facts are concerning the issue of bullying. This issue is relevant to the lives of learners in schools, which will make for an high interest lesson.
Curated OER
Constructing Parallel Lines
Students construct parallel lines using a protractor and a straightedge. In this geometry lesson, students identify the properties of parallel lines. They use Cabri to graph and observe the lines.
Curated OER
Building a Pill Bug Palace
Students make "pets" of isopods (potato bugs) to determine their preferred environment and food sources. They record their results on a bar graph and in a scientific report.
Curated OER
World Oil Packet
In this oil consumption activity, students analyze the data about oil consumption and production in 3 graphs. Students then respond to 12 questions about the data.
Curated OER
Atlatl Lessons Grades 4-12: Lesson for Beginning Users of Atlatl
Sixth graders determine the mean, range median and mode of a set of numbers and display them. In this data instructional activity students form a set of data and use computer spreadsheet to display the information. They extend of...
Curated OER
Circle the Earth - Explore Surface Types on a Journey around Earth
Students use CERES percent coverage surface data with a world map in locating landmasses and bodies of water at Earth's Equator.
Curated OER
Light Beam
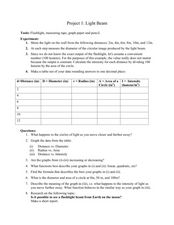
Pupils measure and convert between units. In this geometry lesson, students investigate through measurements of distances. They relate the properties of circle to solving problems with radius, diameter and area.
Curated OER
Find and Color
In this early childhood shape recognition learning exercise, students find circles, triangles, and rectangles in a picture and color them according to the instructions. Students graph the number of each of the 3 shapes on the provided...
Curated OER
Approximating Pi
Students approximate Pi using the lower and upper bound for the constant. In this algebra lesson, students work in groups of two to graph a circle and approximate Pi using the circumference. They repeat their estimation until they come...
Curated OER
Name Fame
First graders learn the uniqueness of their names by reading the book, Chrysanthemum, and completing other integrated math counting and graphing activities.


