Curated OER
Graphing Inequalities
In this graphing inequalities instructional activity, students create graphs of algebraic expressions containing inequalities. This two-page instructional activity contains explanations and examples prior to the exercise. The first...
Curated OER
My Test Book: Reading Pie Charts
In this math skills worksheet, students solve 9 multiple choice math problems that require them to read and interpret charts. Students may view the correct answers.
Curated OER
Rainbow Fish Graphing
Students graph different colors of rainbow fish scales after participating in a shared reading of The Rainbow Fish. They answer questions based on the graph. They practice making graphs independently using colored cereal circles.
Curated OER
Twenty-Eight Multiple Choice No Calculator Allowed AP Calculus BC Practice Exam
In this AP Calculus BC practice exam, students solve twenty-eight multiple choice problems without the use of a calculator. This worksheet should be completed in fifty-five minutes.
Curated OER
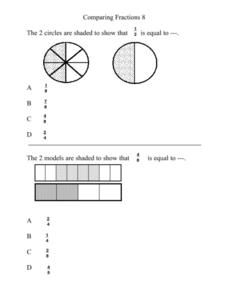
Comparing Fractions 8
In this elementary math worksheet, 5th graders compare fractions using a pie chart and practice finding the values in the multiple choice format.
Curated OER
Modeling With Circular Functions
Students explore circular functions. They identify the amplitude, period, phase shift and vertical shift of circular functions. Students analyze phenomena described by sine waves and they find mathematical models for transforming images...
Curated OER
Graphs - On the Floor and Ask a Friend
Students create a floor graph and then interview their classmates to create their own graph.
Curriculum Corner
7th Grade Math "I Can" Statement Posters
Translate the Common Core math standards into a series of achievable "I can" statements with this collection of classroom displays. Offering posters for each standard, this resource is a great way to support your seventh graders as...
Curated OER
Literacy Activity: The Perfect Pet
Students develop their listening skills as they listen to the book The Perfect Pet. In this reading lesson, students listen to the book, and then talk about the pets they have. Then they make a graph as a class of all their pets.
Curated OER
Ellipses (Part 1)
Students work with Ellipses in Algebra II. In this algebra lesson, students solve an equation with a radical expression. They graph ellipses and write an equation for them.
Curated OER
How can my breakfast help the birds?
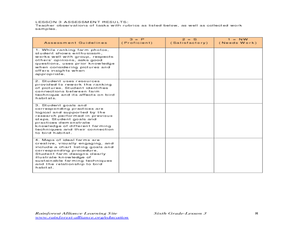
Sixth graders design farms with a bird's habitat in mind. In this farm lesson plan, 6th graders research how sun grown coffee destroys a bird habitat, and then they make their own farm with a bird's habitat being preserved. They then...
Curated OER
Weather "Whys" Lesson 2 Seasons
Students explore seasons. In this cross curriculum weather and seasons lesson, students identify characteristics of the four seasons and sequence related pictures. Students listen to poems and stories about trees in different...
Curated OER
THE AREA OF A CIRCLE
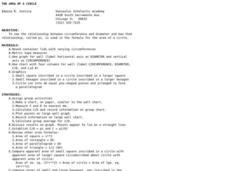
Students examine the relationship between circumference and diameter and how to use the formula to find the area of a circle. In this circle lesson students divide into groups and complete an activity.
Curated OER
Shopping the Sunday Circular
Pupils demonstrate an understanding of price-per-unit mathematics. In this computation lesson, learners accurately figure the unit price of grocery items. They create a chart and record the item, the price, the size and the cost per item.
Exploratorium
Inverse Square Law
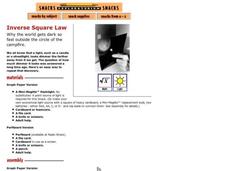
The inverse square law is revealed when your class participates in this activity. They move a graph paper or perfboard square back and forth in a square of light to see how the intensity changes. You will definitely want to add this...
Granite School District
7th Grade CCSS Math Vocabulary Word List
Address key vocabulary in the seventh grade Common Core Math Standards with this comprehensive list. A series of word cards is also provided that supports each term with images and examples, making this an excellent tool for teaching the...
Curated OER
Solar System Planet Research
In this space science activity, students collect data that includes information in a chart or graph to display in a group. They identify and describe various planet features of a specific planet of choice. Students write notes and the...
Curated OER
Who Took the Cookies
Learners find the missing cookies. In this language arts lesson, students solve the mystery of who is taking the cookies from the cookie jar. Learners are read several books with the same mystery of cookies being taken from the jar.
Curated OER
Using the Distance Formula
In this distance formula worksheet, students solve and complete 30 various types of problems. First, they find the exact distance between each pair of points and make a sketch of the situation. Then, students find the center, horizontal...
Inside Mathematics
Rugs
The class braids irrational numbers, Pythagoras, and perimeter together. The mini-assessment requires scholars to use irrational numbers and the Pythagorean Theorem to find perimeters of rugs. The rugs are rectangular, triangular,...
Cornell University
Garden Math
Young scientists must put their math caps on and figure out what fraction of each flower is in a raised flower bed. They must problem solve to simplify the fractions, and then graph the amount of flowers that are in different flower beds.
Curated OER
Fractions, Decimals, and Percents
Learners connect different mathematical concepts. They create a circle graph. Students then create a question in which they collect data in order to convert fractions to decimals and decimals to percents.
Curated OER
Does One Tree a Forest Make?
Students take a walk around the schoolyard looking at and identifying the trees. One leaf for each tree is collected. A chart is developed that represents the population of trees on the school ground. They keep journals and write an essay.
Curated OER
ou are the Researcher!
Students conduct a census at school. They collect data, tally it, and create a frequency table. Students display their data in three different types of graphs. They write complete sentences describing the graph.


