ResourcesWeb & Docs
MediaVideo & Audio
CollectionsLessons & Topics
AI Teacher ToolsInstruction & Ideas
newFilter
785 results:
longitude latitudeClear All
Curated OER
Natural Disasters and the Five Themes of Geography
Have your class do research on natural disasters and create a presentation using this resource. In completing this activity, learners apply the five geography themes to their research. They write a paper describing their results. It's a...
Curated OER
Country facts
In this science facts worksheet, students pick a country and research science facts to put into this graphic organizer. Students complete 10 facts.
Curated OER
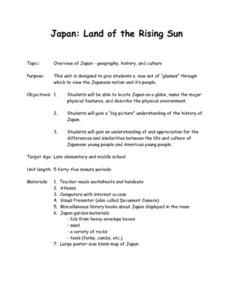
Japan: Land of the Rising Sun
Learners locate Japan on a globe, name the major physical features, and describe the physical environment. They survey the differences and similarities between the life and culture of Japanese young people and American young people.
Curated OER
Projects For USA Units
Learners study different regions of the United states through interdisciplinary activities. This lesson presents very creative, artistic ways for students to explore the variety of regions found in the United States.
Curated OER
Comparison of Snow Cover on Different Continents
Students use the Live Access Server (LAS) to form maps and a numerical text file of snow cover for each continent on a particular date and analyze the data for each map, corresponding text file to determine an estimate of snow cover for...
National Wildlife Federation
I’ve Got the POWER Wind Energy Potential at Your School
The 20th lesson in a 21-part series connects the wind data and expectations of a turbine to whether such devices should be built in your area. Scholars begin with estimating the wind potential at school by using long-term climate...
National Wildlife Federation
I Speak for the Polar Bears!
Climate change and weather extremes impact every species, but this activity focuses on how these changes effect polar bears. After learning about the animal, scholars create maps of snow-ice coverage and examine the yearly variability...
Montana State University
What's the Weather?
How many jackets do you need to stay warm and climb Mount Everest? An informatie resource covers the topic of Mount Everest, the resource helps young scientists discover the difference between climate and weather. Activities include...
Curated OER
Creating Climographs
Students use satellite data to compare precipitation and surface temperatures on different islands. In this satellite instructional activity students create graphs and explain the differences between weather and climate.
Curated OER
Applications of the Pythagorean Theorem - Magnetism
Middle and high schoolers use the Pythagorean Theorem to complete a table showing with the magnetic field strengths in given cities. They find the average value of the Earth's magnetic field and plot one of the three-dimensional values...
Curated OER
Is Portland, Oregon Experiencing Global Warming?
Students use data to determine if the climate in Portland has changed over the years. For this weather lesson students complete line graphs and study long wave radiation.
University of Colorado
Phases of Charon
Pluto, although no longer considered a planet, has five moons. Pluto's moon, Charon, is the focus of a resource that describes how the moon is viewed from the surface of Pluto. Photos help individuals see how Charon would look at...
Concord Consortium
Center of Population
Let the resource take center stage in a lesson on population density. Scholars use provided historical data on the center of the US population to see how it shifted over time. They plot the data on a spreadsheet to look the speed of its...
Mr. Head's 6th Grade Classroom
Absolute Location
How do we know where we are in the world? A presentation for middle schoolers explains absolute location and other geography terms such as relative location. It also gives scholars the opportunity to practice finding absolute location on...
Curated OER
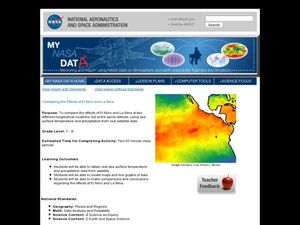
Comparing the Effects of El Nino and La Nina
Learners examine the differences between an El Nino and La Nina year. In this investigative lesson students create maps and graphs of the data they obtained.
Curated OER
Solar Cell Energy Availability From Around the Country
Students determine areas that are the most likely to produce solar energy by using NASA data. In this solar energy lesson students analyze plots and determine solar panel use.
Curated OER
True North, Magnetic North
Students explain why compass angles need to be corrected for regional magnetic variation. They observe the difference between magnetic and true north. Each student measures the angle of variation for a town in a different state.
Curated OER
Student Tracking
Here is an interesting lesson plan on satellite tracking. Learners use various tracking techniques to find out where they go on a daily basis, what the environmental conditions are, and what they are doing during their "migrations." A...
Curated OER
Broken-Heart Matching Game
Learners use this fun game to practice, reinforce, or apply a wide variety of skills around Valentine's Day. Each students receives half a heart with zig-zag cuts made of pink construction paper with a piece of information. Their job is...
Curated OER
The Landscape of a Novel
Learners, after reading a novel, utilize geographic skills to map out the places described in the novel. They collect data, envision spatial features and then design a map to work off of to complete their assignment. Each student also...
Curated OER
Plotting Earthquakes
Students plot earthquakes on a map. For this lesson on earthquakes, students will explore recent earthquake activity in California and Nevada. Students will plot fault lines and earthquake occurrences on a map.
Curated OER
Basic Mapping Skills
Establish and study the parts of a map with your class and, then they will work in small groups to create their own detailed map, including a legend. There are specific instructions to follow on what needs to be included.
Curated OER
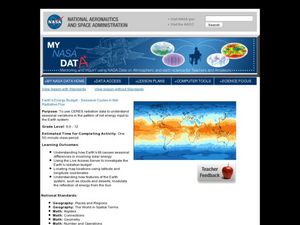
Earth's Energy Budget - Seasonal Cycles in Net Radiative Flux
Students attempt to understand seasonal variation by viewing images of the energy received by the earth. In this weather lesson, students view images from NASA of the influx of energy from the sun and make predictions about resulting...
Curated OER
Cold, Clouds, and Snowflakes
Students explore satellite data and graphing. In this weather data analysis math and science lesson, students analyze NASA satellite data to draw conclusions about geographical areas where precipitation might have happened. Students...
Other popular searches
- Latitude and Longitude
- Latitude Longitude
- Latitude and Longitude Games
- Latitude & Longitude
- Latitude and Longitude Maps
- Longitude and Latitude Game
- Longitude and Latitude Math
- Geography Latitude Longitude
- Whaling Latitude Longitude
- Longitude Latitude Minutes
- Longitude and Latitude Lines
- Volcano Latitude Longitude


